Back in September 2025, we looked at how the market’s valuation and chart action were similar to the dot-com bubble. Now, 10 months later, this bull run has lasted longer than usual and pushed the S&P 500 to new highs.
This bull market started on October 12, 2022, just before ChatGPT launched. It has lasted 1,314 days, and the S&P 500 has risen by about 106.6 percent since then. It should soon outlast the 1,324-day bull market from June 1962 to February 1966, according to data from Bespoke. (The number of days in the chart below is listed as 1,304 days because it was last updated on May 8, 2026.)
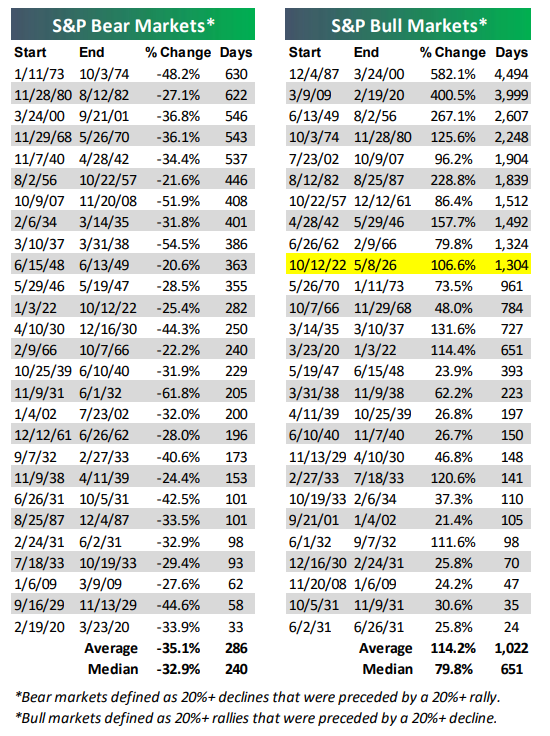
Looking at all 27 bull markets since 1928, the average lasted 1,022 days (the median was 651 days). The average gain of those bull runs was 114.2 percent (the median was 79.8 percent). Today’s bull market is longer than most in duration and similar in magnitude. It is the 10th longest out of the 27, so it is not a young bull market, but not unprecedented.
For context, the longest bull market lasted over 12 years, from December 1987 to March 2000, as the technology stock bubble was forming (we will compare that period below). That run saw a 582.1 percent gain. The second longest was from March 2009 to February 2020, and it was almost as long. It was fueled, in part, by innovations in mobile and cloud technologies. While most bull markets last about three years and double in value, the longest ones last much longer and go much higher when driven by major new technology (artificial intelligence), massive fiscal spending (the One Big Beautiful Bill Act), or reversions to the mean following bear markets (the dual bear markets of 2000 and 2022).
The 1990s overlay, updated
About two years ago, I began comparing today’s market to the tech-driven market of the 1990s. Now that the Q1 2026 corporate earnings season is nearly over and the market has moved higher again, it is a good time to revisit that comparison. For the technology-heavy Nasdaq stock market index, the similarities to the 1990s remain.
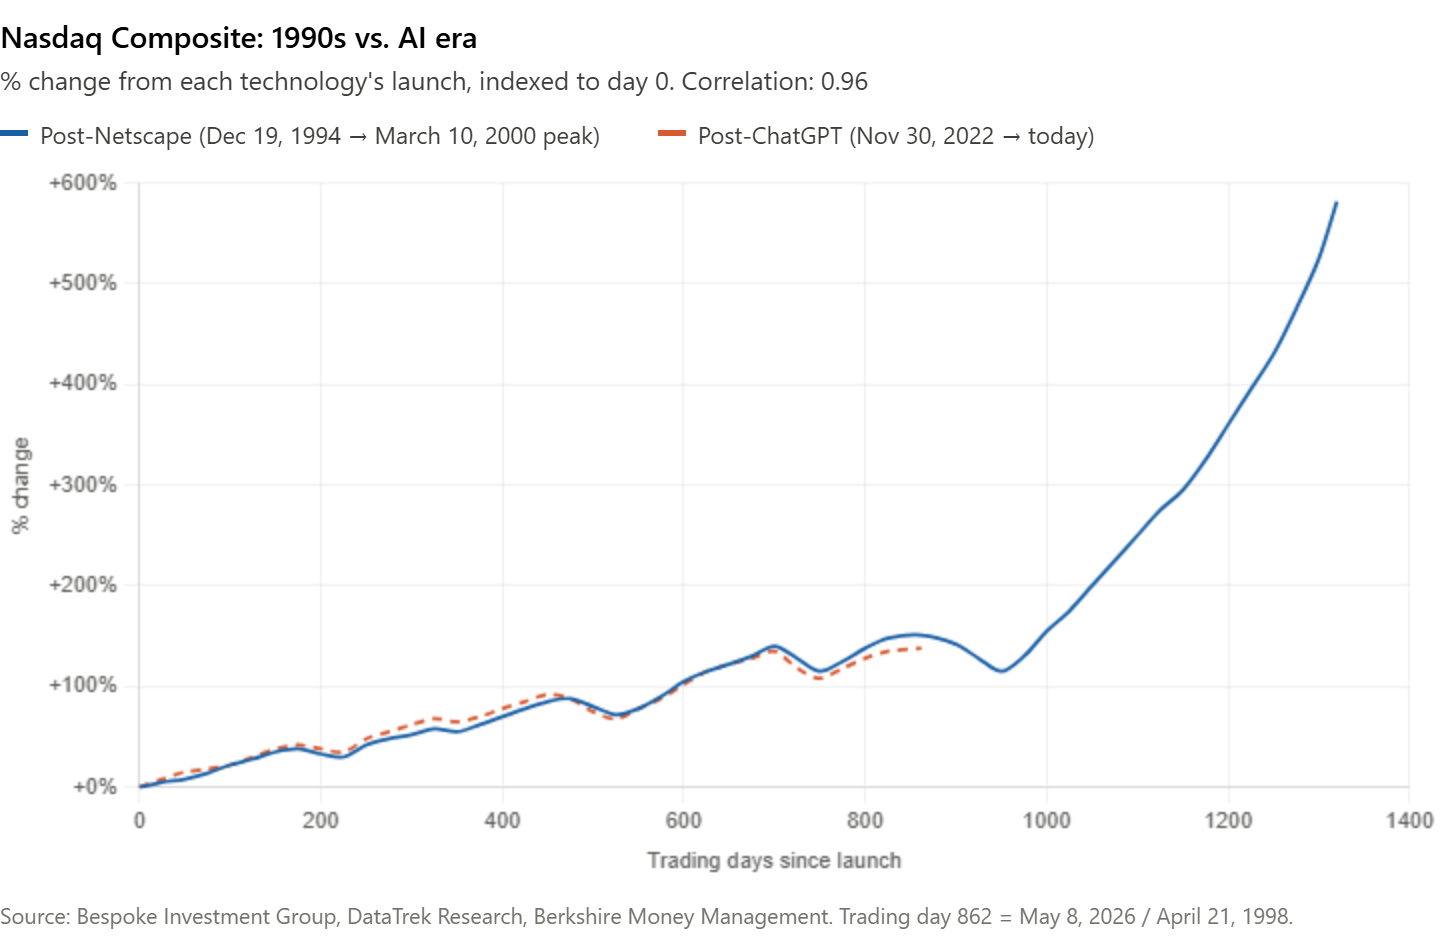
For those comparisons, we consider the launch of the Netscape Navigator internet browser in October 1994 and compare it to today’s transformative technology, ChatGPT, released in November 2022.
On trading day 862, after each technology appeared, the Nasdaq after Netscape was up about 151.2 percent, while the Nasdaq after ChatGPT was up about 137.6 percent, according to Bespoke. The two paths are highly correlated at 0.96. Even if you are skeptical about these similarities, it is hard to ignore how much the charts have in common.
Both periods saw two Fed rate shocks (in 1994 and 2022) that did not trigger a recession, and both featured disruptive technologies that quickly altered investor expectations. The market’s path was not smooth. The April 2025 tariff drop and rebound matched the early-1997 recovery after Federal Reserve Chair Alan Greenspan’s “irrational exuberance” speech. The recent oil shock from the Iran conflict pulled the Nasdaq down 13.2 percent from its October 2025 high before it bottomed on March 30, similar to the 14.1 percent drop during the 1997 Asian Financial Crisis.
If the pattern from the 1990s continues, we could see a 10-ish percent correction into early summer, followed by a sharp rally, and then a bigger sell-off caused by a new macro event. In the 1990s, the sell-off was due in part to Russia’s debt default and the near-collapse of the Long-Term Capital Management hedge fund, followed by Fed rate cuts that pushed the Nasdaq higher by year end. From May 1998 to May 1999, the Nasdaq rose about 35 percent. If we see a similar move, the Nasdaq could move from about 26,000 today to roughly 35,000 by the end of 2027. Let’s make it clear that is not a prediction. But it is also not impossible—especially if a bubble in AI stocks does form.
Why this is not 1999
The four most dangerous words in investing are: “This time it’s different.” However, when it comes to valuations, this time feels different. I was in the industry in the 1990s and saw firsthand what a real bubble looked like.
In 1999, sell-side analysts could not justify their recommendations with traditional metrics, so they made up new ones. There were “price-to-eyeballs,” which meant market cap divided by website visitors, even for companies with no profits. There was “price-per-engineer” for firms whose main asset was their staff. Pro-forma earnings left out so many costs that people joked about EBBS: Earnings Before Bad Stuff. When sellers have to invent new ways to make stocks look cheap, that is a bubble signal.
By early 2000, about 86 percent of Nasdaq initial public offerings (IPOs) were unprofitable, and Cisco’s price-to-sales (P/S) ratio hit 200 times. Today’s analogous company to Cisco might be Nvidia, and its P/S ratio is about 25, with a 10-year median of about 10—much more reasonable than Cisco’s 200 times.
Today’s rally is different. According to FactSet, in Q1 2026, the S&P 500 saw year-over-year earnings growth of 27.7 percent, the fastest since late 2021 and the sixth straight quarter of double-digit growth. Eighty-four percent of S&P 500 companies beat earnings estimates, the highest rate since Q2 2021. The net profit margin is at a record 14.7 percent. The S&P 500’s forward P/E ratio is 21.0, which is above the five- and 10-year averages of 19.9 and 18.9, but still far below the 33 seen in 1999.
The risks I am watching
I always make sure to consider all the risks, even (especially?) when things appear rosy. If you don’t, you’re speculating, not investing. Here is a quick list of concerns:
The market looks overbought. The S&P 500 is 7.7 percent above its 50-day moving average, which is about two standard deviations, according to DataTrek. The Nasdaq 100 is 14 percent above its 50-day moving average, the highest level since the 2009 financial crisis. The Philadelphia Semiconductor Index, or SOX, is 33.4 percent above its 50-day, a level seen only three times before: in November 2002, March 2000, and December 1998. The SOX stocks now make up 23 percent of the S&P 500’s market cap, up from six percent a year ago. If the market pulls back to the 50-day average, the S&P could drop from about 7,400 to 6,900—a seven percent decline. That would be uncomfortable, but it is a normal move after a sharp rally.
Market breadth is weak. Even though the index is near all-time highs, only half of S&P 500 stocks are above their 50-day moving averages, and only about 57 percent are above their 200-day moving averages, according to DataTrek. Since 1990, the only other times the index reached a record high with such narrow breadth were December 1998, April 1999, December 1999, and March 2000. Remember the dot-com crash that happened after? That is not a great sign.
Consumers are feeling the strain. Mortgage rates are high. Gas prices are through the roof of the houses people can’t afford. The U.S. is at war. The University of Michigan’s consumer sentiment index just hit an all-time low for the second month in a row. Earnings can stay strong for a while even when sentiment is low, but not forever.
The takeaway
Right now, we are about where we were in mid-1998 in the 1990s comparison. Back then, the best move was to stay invested through the ups and downs, even when things looked scary, because the long-term bull market driven by new technology still had another year and a half to go. The mistake was calling the top too early and missing out on the gains. Not that I expect that type of 1990s-style return; I mention it to illustrate that sometimes it makes sense to stay the course in a well-balanced portfolio, even when there are concerns.
I am not making big changes to my portfolio. I am rebalancing when it makes sense and keeping in mind that seven percent to 10 percent pullbacks are normal and don’t always portend the end of bull markets. I am keeping an eye on market breadth, IPO activity, and new valuation methods as early warning signs. If earnings calls start using non-GAAP metrics to stretch out AI infrastructure costs or talk about “tokens processed” instead of revenue, or value companies based on GPU (graphics processing unit) counts, then I will take bubble warnings more seriously. For now, we are not at that point, so I don’t need to make those big portfolio changes just yet.
Allen Harris is an owner of Berkshire Money Management in Great Barrington and Dalton, managing more than $1 billion of investments. Unless specifically identified as original research or data gathering, some or all of the data cited is attributable to third-party sources. Unless stated otherwise, any mention of specific securities or investments is for illustrative purposes only. Advisor’s clients may or may not hold the securities discussed in their portfolios. Advisor makes no representation that any of the securities discussed have been or will be profitable. Full disclosures here. Direct inquiries to Allen at [email protected].