

- US Stock Benchmarks are somewhat easing after their past week of over-ecstatic gains in the midst of continued geopolitical confusion
- Traders are preparing for a very important earnings week (Apple, Microsoft, Google, Meta, Amazon)
- Exploring Technical Levels for the Dow Jones, Nasdaq and S&P 500
US stock benchmarks are somewhat easing today, taking a seemingly logical breather after last week’s run of over-ecstatic gains (particularly in the tech sector), with other global indexes closing their sessions mixed.
Up until now, the market has been stubbornly acting as if the ongoing conflict in Iran is a complete non-factor, but that blissful ignorance is beginning to show cracks in the midst of continued geopolitical confusion.
Despite a flurry of weekend diplomatic announcements, the overarching peace narrative remains frustratingly uncertain.
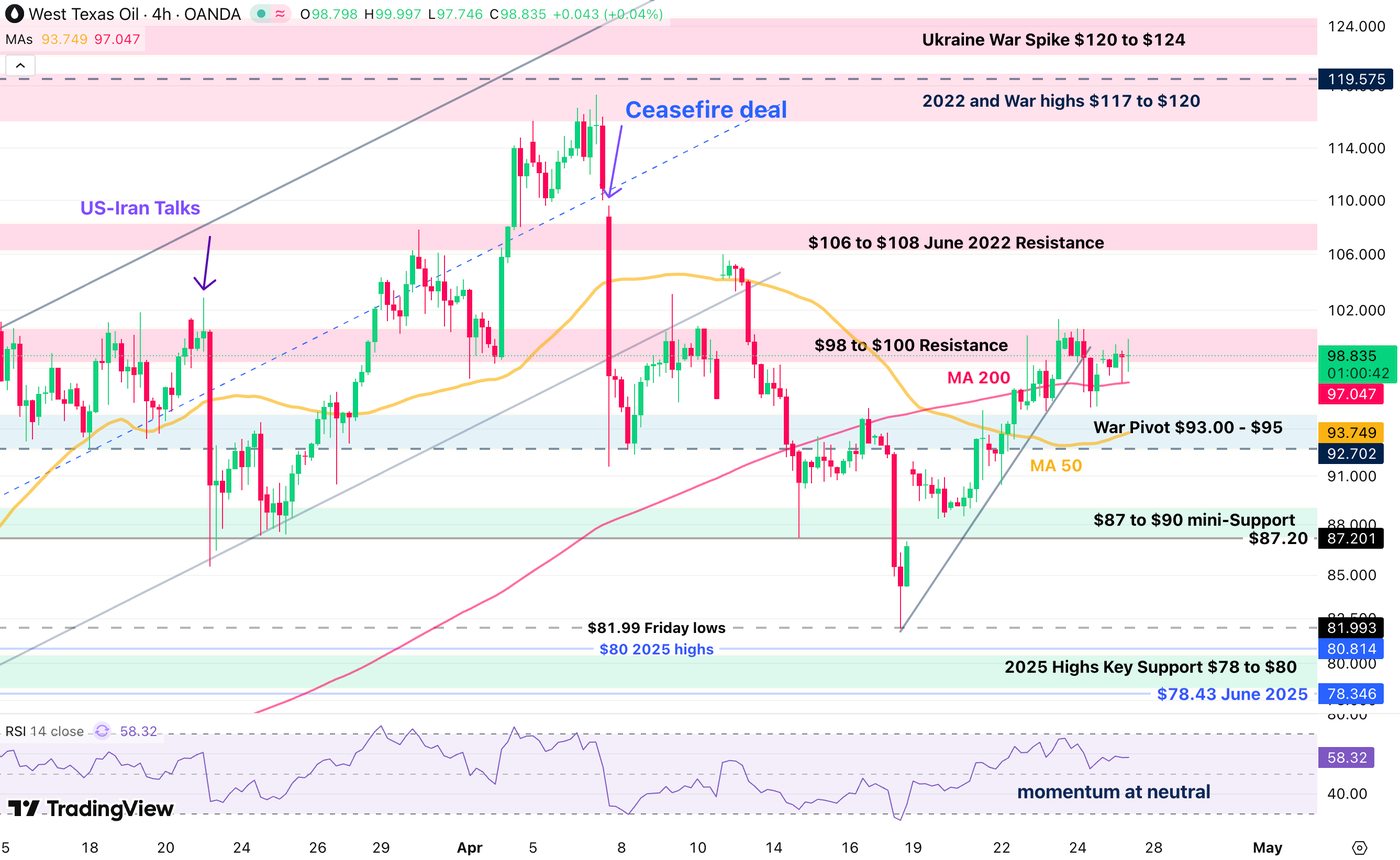
Reality is slowly setting back in as the week begins on a softer tone, heavily punctuated by WTI Crude extending to two-week highs.
After all, physical droughts are still a key factor for global economies and while the US Oil sector shines from increased orders, there is still quite some anxiety with some ~14 million barrels still missing with the Hormuz closure.
Adding fair pressure to the intraday anxiety is the looming barrage of mega-cap earnings.
Traders are nervously preparing for a make-or-break week as the US Markets’ absolute heavyweights—Apple, Microsoft, Google, Meta, and Amazon—are all slated to publish their, with a massive concentration of these reports expected to hit the tape on Wednesday.
After its relentless trading in the past week, the semiconductor sector is pulling back.
Investors are actively taking chips off ahead of the game changing fundamental news releases – But the overall Market is still resilient, with rebalancing in Stocks rather than a full-on selloff.
While the tech-heavy Nasdaq and the S&P 500 recently managed to print new records, the Dow Jones remains stuck in a choppy sideways range (easing from the 50,000 milestone), so investors will want to see a rebound there to maintain the high spirits.
Let’s dive into intraday charts and trading levels for the Dow Jones Industrial Average, Nasdaq Composite, and S&P 500.
Current Session’s Stock Heatmap
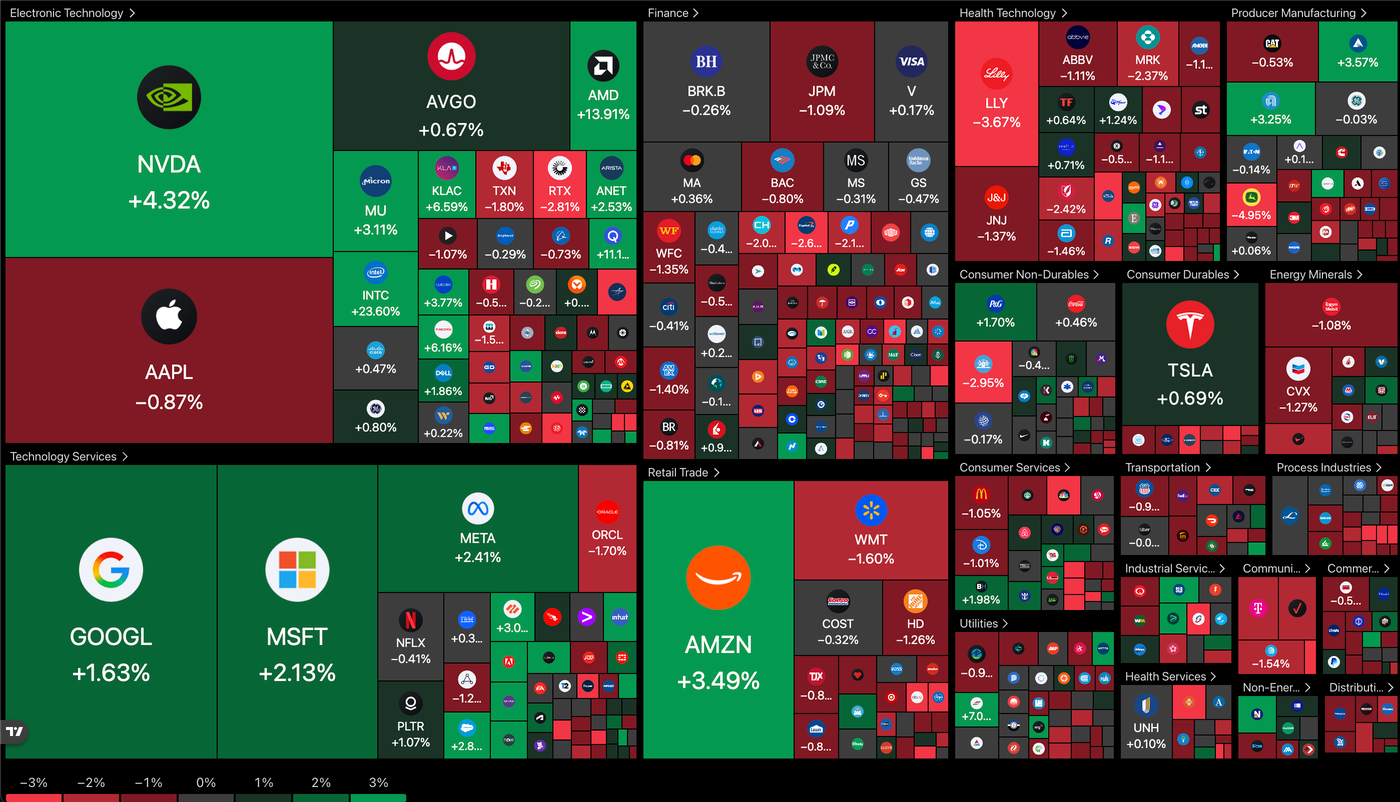
As was explored in the introduction, semiconductors are taking a hit and this is marking quite a change compared to the past weeks where the sector was propulsing all US Indexes higher.
With Financials earnings now done (except for Visa and Mastercard reporting tomorrow), there is some attraction back towards the sector amid a timid, defensive rebalancing.
Dow Jones 4H Chart and Trading Levels
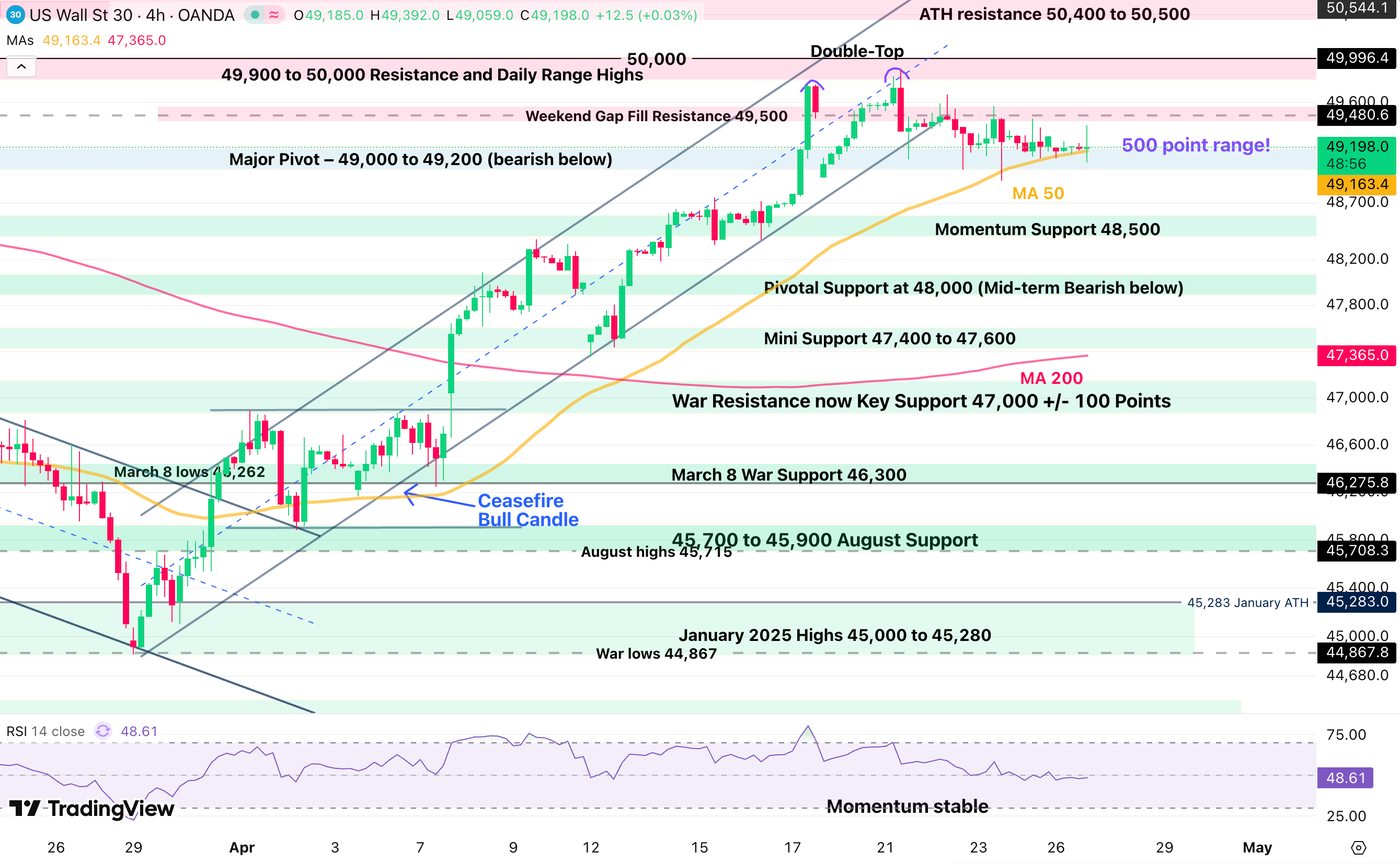
As can be seen with the many indecisions doji candles, the DJIA is evolving within an important 500 point consolidation.
All there is to now is that traders can either trade the small range (tight stops and small size required) until news change the situation, or trade the breakout when it happens.
- 49,000 is the bottom support (look at a close below the 4H 50-period MA)
- 49,500 is the top resistance
Dow Jones technical levels for trading:
Resistance Levels
- Weekend Gap Fill Resistance 49,500 – 49,600
- 49,900 to 50,000 Resistance and Early 2026 Highs
- All-Time Highs 50,544
Support Levels
- 4H 50-period MA (49,050)
- Major Pivot – 49,000 to 49,200 (short-term bearish below)
- Momentum Support 48,500
- Pivotal Support at 48,000 (Mid-term Bearish below)
- Mini Support 47,400 to 47,600
Nasdaq 4H Chart and Trading Levels
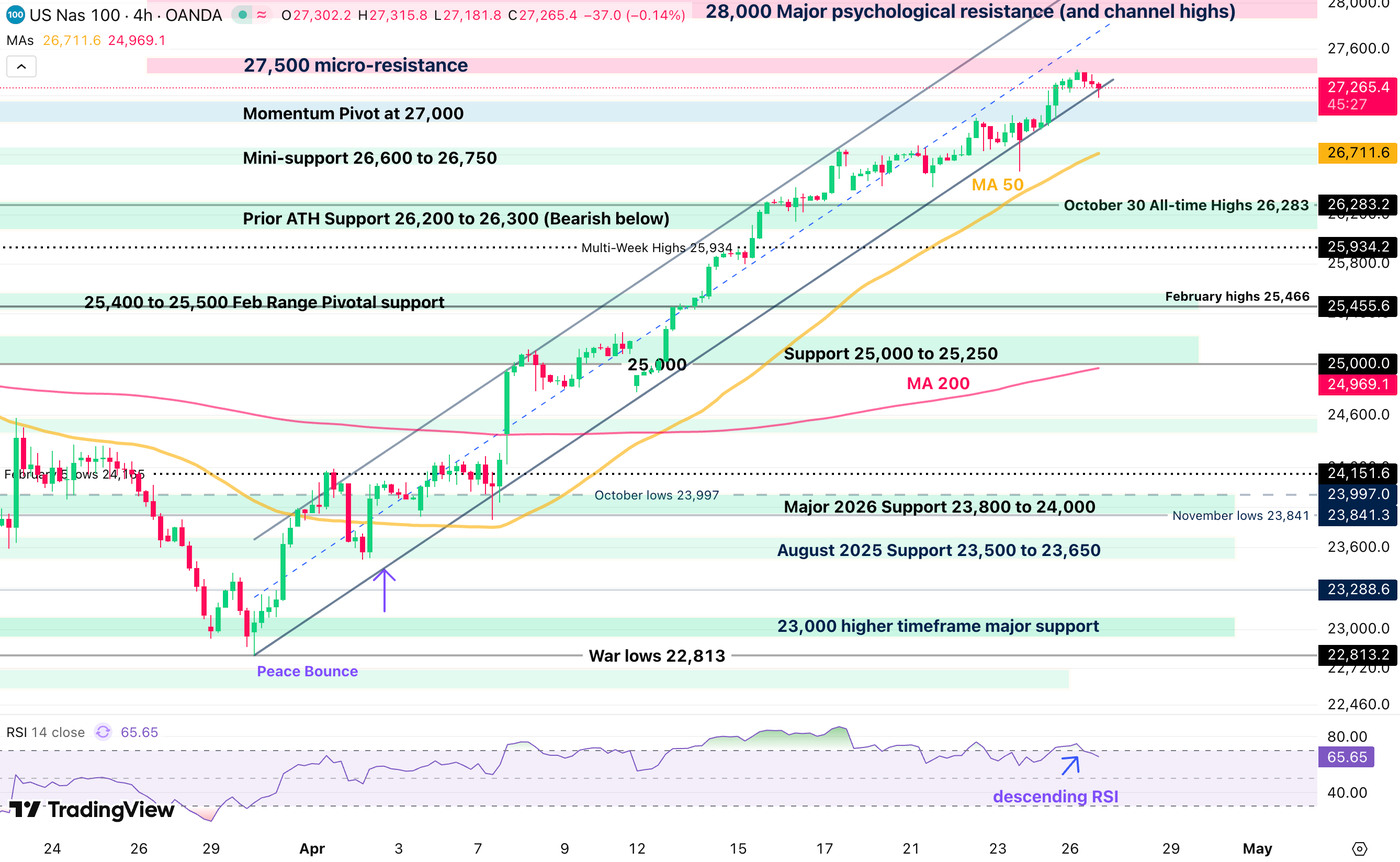
Nasdaq is actually showing decent potential for a reversal, with its overbought momentum now largely easing and sellers testing the lower bound of the peace-bull channel.
Breaking it should bring fast-paced profit-taking towards the preceding all-time highs. Such would preferably be seen ahead of Wednesday’s market close Mag 7 earnings.
Nasdaq technical levels of interest:
Resistance Levels
- Daily highs 27,424
- 27,500 micro-resistance
- 28,000 Major psychological resistance (and channel highs)
Support Levels
- Daily lows 27,120 (bearish below)
- Momentum Pivot at 27,000
- Prior ATH Support 26,200 to 26,300
- War Support 25,000 to 25,250
- Early 2025 ATH at 22,000 to 22,229 Support
S&P 500 4H Chart and Trading Levels
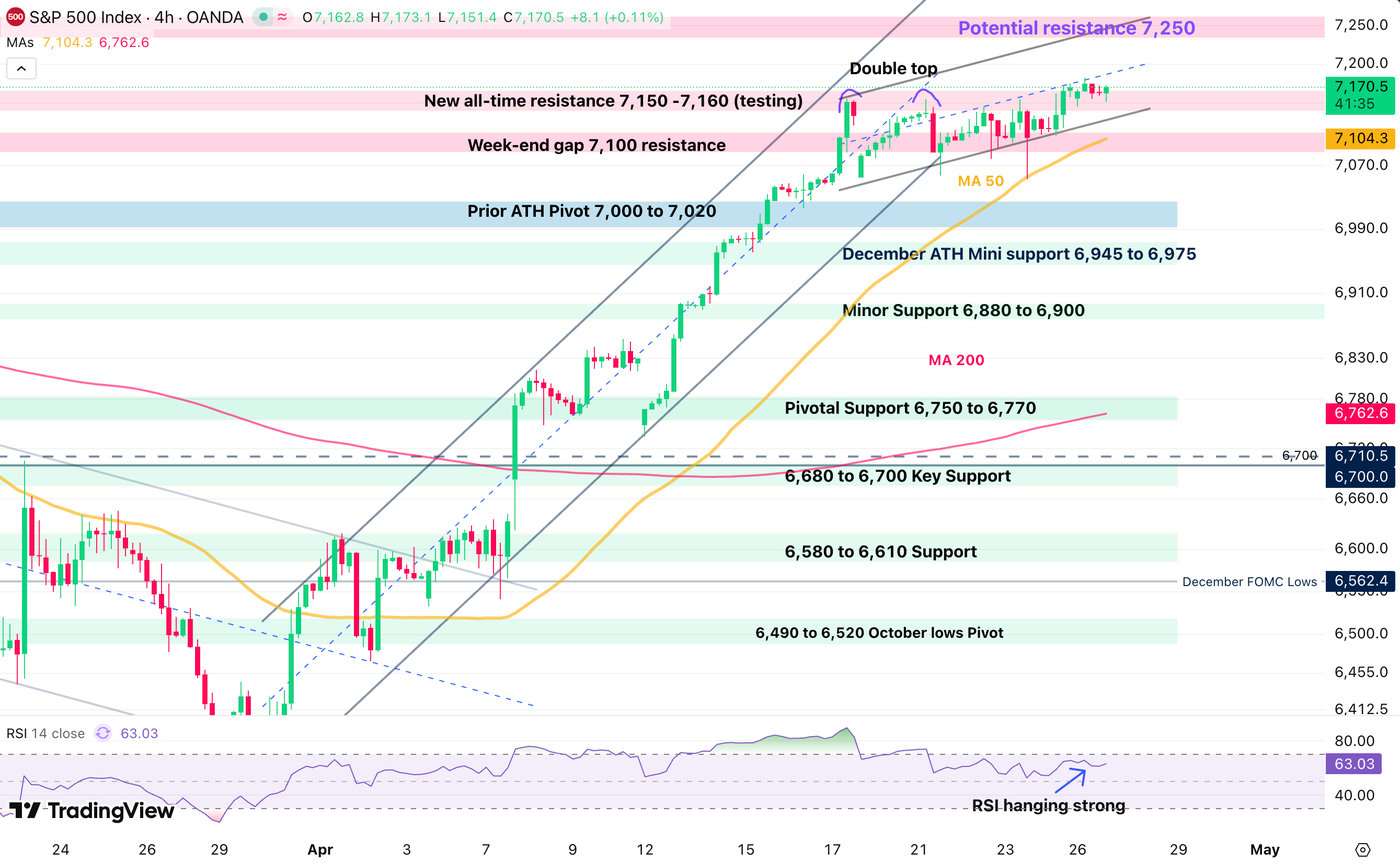
The S&P 500 is actually showing the most resilience, attempting a break above its prior week’s 6,165 all-time highs.
Watch out for fakeouts, as traders will want to see a high volume breakout to assume an extension higher.
A mini-bull channel is currently forming, but buyers will want to extend the action above its mid-line (6,185).
S&P 500 technical levels of interest:
Resistance Levels
- Daily highs 7,185
- New all-time resistance 7,150 – 7,160 (breaking)
- Next key potential resistance 7,200
- Mini-channel highs 7,2560
Support Levels
- 7,100 psychological level and 4H 50-period MA
- Prior ATH Pivot 7,000 to 7,020
- Minor Support 6,880 to 6,900
- Pivotal Support 6,750 to 6,770
- 6,300 psychological level (War lows)
Keep track of WTI Crude and the latest headlines throughout the week to stay ahead of the curve, with investors still confused about US-Iran negotiations.
Safe Trades!
Follow Elior on Twitter/X for Additional Market News, interactions and Insights @EliorManier
Opinions are the authors’; not necessarily that of OANDA Business Information & Services, Inc. or any of its affiliates, subsidiaries, officers or directors. The provided publication is for informational and educational purposes only.
If you would like to reproduce or redistribute any of the content found on MarketPulse, an award winning forex, commodities and global indices analysis and news site service produced by OANDA Business Information & Services, Inc., please refer to the MarketPulse Terms of Use.
Visit https://www.marketpulse.com/ to find out more about the beat of the global markets.
© 2026 OANDA Business Information & Services Inc.
About the Author

Elior Manier
Market Analyst
Elior brings over seven years of experience in financial markets to our analyst team. Since 2018, he has actively engaged in observing, charting, and trading, driven by his passion for mastering market dynamics. With a profound understanding of the geopolitical and macroeconomic forces that shape market movements, Elior focuses on analysing the impact of breaking news, market sentiment, and critical economic data releases on trading flows.
As a versatile analyst, he contributes powerful insights to the team, effectively integrating geopolitical and technical analysis to provide clear and comprehensive market perspectives.
Prior to joining our team, Elior honed his expertise as a Fixed Income Trader and Market Analyst at the Montreal Exchange.