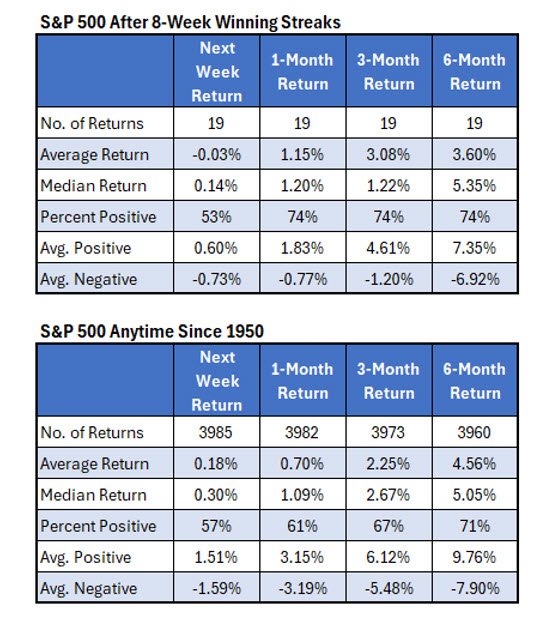
Last week marked eight straight weeks of gains for the S&P 500 Index (SPX). It’s the 20th such winning streak for the index since 1950. The table below summarizes the SPX performance going forward after the other streaks.
I’ve been doing this for some time now, and traders tend to get nervous during such winning streaks or when there’s an overbought indicator flashing. But then I run the numbers and they show momentum leads to more momentum, with forward returns after a signal beating typical market returns.
The data below, however, does suggest this is a common time for the SPX to take a short breather. The next-week results after eight straight weeks of gains shows positive returns just about half the time, and a slight loss on average. But then the momentum tends to pick back up, with one and three-month returns after the streaks beating their usual return. For example, the month after the winning streaks, the SPX was up on average 1.15% with 74% of the returns positive. Typically, the SPX averages a return of 0.7% for that timeframe, with 61% of returns positive. Six months after an eight-week win streak, the returns look more like typical market returns.

Even after eight weeks of gains, sentiment surveys aren’t showing a lot of optimism. In the rest of the article, I’ll show the individual streaks — along with two sentiment surveys — at the time they occurred to see if that changes anything. I’ll also look at some individual stocks also on a weekly win streak, including Apple (AAPL), to see if they tend to hold up after their own streaks.
Streaks and Sentiments
The table below lists the individual eight-week win streaks since 1950. I also show information on two sentiment polls. One is the Investors Intelligence (II) poll in which the editors collect over 100 published market newsletters and determine the percentage that are bullish, bearish, or expecting a correction (short-term bearish but longer term bullish). The second one is a weekly survey of its members by the American Association of Individual Investors (AAII). Members are asked their opinion on where they see the market heading over the next six months.
The table shows the AAII poll is negative, meaning there are more bears in their membership than bulls. We have poll data since 1987, and there’s been nine streaks since then. This is the second time the AAII poll had more bears than bulls in the survey as the SPX weekly win streak hit eight. The other time was in September of 1993. A contrarian would suspect bullish implications in this situation, but that was not the case. The SPX was up less than 0.5% after three months and barely up 1% over the next six months.