n
Companies worth $10 billion or more are generally described as u201clarge-cap stocks,u201d and EQT perfectly fits that description, with its market cap exceeding this mark, underscoring its size, influence, and dominance within the oil & gas E&P industry. EQTu2019s strength lies in its status as a foundational player in global Oil & Gas E&P. Under its leadership team, the company executes a disciplined multi-year strategy that pairs growth investment with consistent shareholder returns.
n
Despite its notable strength, EQT slipped 25.7% from its 52-week high of $68.24, achieved on Mar. 27. Over the past three months, EQT stock has declined 20.2%, underperforming the Dow Jones Industrials Averageu2019s ($DOWI) 12% gains during the same time frame.
n
 n
nn
Shares of EQT fell 5.4% on a YTD basis and dipped 14.6% over the past 52 weeks, underperforming DOWIu2019s YTD gains of 7.3% and 22.3% returns over the last year.
n
To confirm the bearish trend, EQT has been trading below its 200-day moving average since late May. The stock is trading below its 50-day moving average since early April, with slight fluctuations.
n
 n
nn
On Apr. 21, EQT reported its Q1 results, and its shares closed up more than 3% in the following trading session. Its revenue stood at $3.4 billion, up 94.2% year over year. The companyu2019s adjusted EPS increased 97.5% from the year-ago quarter to $2.33.
n
In the competitive arena of oil & gas E&P, Diamondback Energy, Inc. (FANG) has taken the lead over EQT, showing resilience with a 22.1% uptick on a YTD basis and solid 23.3% gains over the past 52 weeks.
n
Wall Street analysts are bullish on EQTu2019s prospects. The stock has a consensus u201cStrong Buyu201d rating from the 25 analysts covering it, and the mean price target of $69.87 suggests a notable potential upside of 37.8% from current price levels.
On the date of publication, Neha Panjwani did not have (either directly or indirectly) positions in any of the securities mentioned in this article. All information and data in this article is solely for informational purposes. For more information please view the Barchart Disclosure Policy here. “,”symbols”:[{“symbol”:”FANG”,”symbolName”:”Diamondback Energy”,”symbolType”:1,”lastPrice”:”183.50″,”priceChange”:”-1.98″,”percentChange”:”-1.07%”},{“symbol”:”EQT”,”symbolName”:”Eqt Corp”,”symbolType”:1,”lastPrice”:”50.72″,”priceChange”:”-0.41″,”percentChange”:”-0.80%”},{“symbol”:”$DOWI”,”symbolName”:”Dow Jones Industrial Average”,”symbolType”:9,”lastPrice”:”51,564.70″,”priceChange”:”unch”,”percentChange”:”unch”}],”related”:[{“id”:”2563887″,”title”:”CF Industries Stock: Is CF Underperforming the Materials Sector?”,”slug”:”cf-industries-stock-is-cf-underperforming-the-materials-sector”,”feedName”:”Barchart”,”published”:”Sat Jun 20, 12:07AM CDT”,”categories”:[“STK.EQY”]},{“id”:”2563536″,”title”:”Is Pool Corporation Stock Underperforming the Nasdaq?”,”slug”:”is-pool-corporation-stock-underperforming-the-nasdaq”,”feedName”:”Barchart”,”published”:”Fri Jun 19, 9:56PM CDT”,”categories”:[“STK.EQY”]},{“id”:”2562883″,”title”:”Is Robinhood Markets Stock Outperforming the S&P 500?”,”slug”:”is-robinhood-markets-stock-outperforming-the-sp-500″,”feedName”:”Barchart”,”published”:”Fri Jun 19, 7:20PM CDT”,”categories”:[“STK.EQY”]},{“id”:”2558604″,”title”:”Is MGM Resorts International Stock Outperforming the S&P 500?”,”slug”:”is-mgm-resorts-international-stock-outperforming-the-sp-500″,”feedName”:”Barchart”,”published”:”Fri Jun 19, 12:10PM CDT”,”categories”:[“STK.EQY”]},{“id”:”2558557″,”title”:”Is Evergy Stock Underperforming the Nasdaq?”,”slug”:”is-evergy-stock-underperforming-the-nasdaq”,”feedName”:”Barchart”,”published”:”Fri Jun 19, 12:03PM CDT”,”categories”:[“STK.EQY”]},{“id”:”2558000″,”title”:”Insulet Corporation Stock: Is PODD Underperforming the Healthcare Sector?”,”slug”:”insulet-corporation-stock-is-podd-underperforming-the-healthcare-sector”,”feedName”:”Barchart”,”published”:”Fri Jun 19, 11:08AM CDT”,”categories”:[“STK.EQY”]},{“id”:”2557844″,”title”:”How Is Healthpeak Properties’ Stock Performance Compared to Other Real Estate Stocks?”,”slug”:”how-is-healthpeak-properties-stock-performance-compared-to-other-real-estate-stocks”,”feedName”:”Barchart”,”published”:”Fri Jun 19, 10:55AM CDT”,”categories”:[“STK.EQY”]},{“id”:”2557838″,”title”:”Is Franklin Resources Stock Outperforming the Dow?”,”slug”:”is-franklin-resources-stock-outperforming-the-dow”,”feedName”:”Barchart”,”published”:”Fri Jun 19, 10:55AM CDT”,”categories”:[“STK.EQY”]},{“id”:”2557384″,”title”:”How Is Steel Dynamicsu2019 Stock Performance Compared to Other Steel Stocks?”,”slug”:”how-is-steel-dynamics-stock-performance-compared-to-other-steel-stocks”,”feedName”:”Barchart”,”published”:”Fri Jun 19, 10:22AM CDT”,”categories”:[“STK.EQY”]}],”sourceId”:”10953646″,”media”:”text”,”thumbnail”:{“url”:”https://media.barchart.com/contributors-admin/common-images/images/Stocks%2C%20Markets%2C%20%26%20Global%20Economy/Charts%2C%20tickers%2C%20traders/3d%20illustration%20inflation%20and%20deflation%20graph%20by%20Deepadesigns%20via%20Shutterstock.jpg”,”width”:1600,”height”:1067,”caption”:”3d illustration inflation and deflation graph by Deepadesigns via Shutterstock”},”summary”:”EQT Corporation has underperformed the Dow over the past year, but analysts are highly optimistic about the stocku2019s prospects.”,”canonicalUrl”:”https://www.barchart.com/story/news/2556653/is-eqt-corporation-stock-underperforming-the-dow”,”slug”:”is-eqt-corporation-stock-underperforming-the-dow”,”sourceFeed”:”CONT2″,”categories”:[“FUT.ENG”,”STK.EQY”,”STK.IND.ENG”],”meta”:”N/A”,”authorBadge”:null,”raw”:{“id”:”2556653″,”title”:”Is EQT Corporation Stock Underperforming the Dow?”,”author”:”Neha Panjwani”,”authorUrl”:”https://www.barchart.com/news/authors/420/neha-panjwani”,”authorImage”:”https://media.barchart.com/news/authors/420/avatar-8hJBHMX599s4Mavv.png”,”authorType”:”author”,”feed”:”SANDP”,”originalFeed”:null,”feedName”:”Barchart”,”feedUrl”:”https://www.barchart.com”,”published”:1781879210,”publishedTime”:”2026-06-19 14:26:50″,”updated”:”2026-06-19 14:26:51 +0000″,”image”:{“url”:”https://media.barchart.com/contributors-admin/common-images/images/Stocks%2C%20Markets%2C%20%26%20Global%20Economy/Charts%2C%20tickers%2C%20traders/3d%20illustration%20inflation%20and%20deflation%20graph%20by%20Deepadesigns%20via%20Shutterstock.jpg”,”width”:1600,”height”:1067,”caption”:”3d illustration inflation and deflation graph by Deepadesigns via Shutterstock”},”content”:”
EQT Corporation (EQT), headquartered in Pittsburgh, Pennsylvania, operates as a natural gas production company. With a market cap of $32 billion, EQT is an integrated energy company with emphasis on Appalachian area natural-gas supply, transmission, and distribution, offering its products to wholesale and retail customers.
n
Companies worth $10 billion or more are generally described as u201clarge-cap stocks,u201d and EQT perfectly fits that description, with its market cap exceeding this mark, underscoring its size, influence, and dominance within the oil & gas E&P industry. EQTu2019s strength lies in its status as a foundational player in global Oil & Gas E&P. Under its leadership team, the company executes a disciplined multi-year strategy that pairs growth investment with consistent shareholder returns.
n
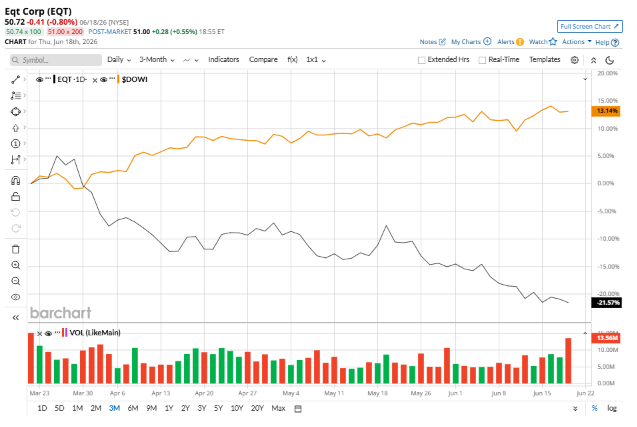
Despite its notable strength, EQT slipped 25.7% from its 52-week high of $68.24, achieved on Mar. 27. Over the past three months, EQT stock has declined 20.2%, underperforming the Dow Jones Industrials Averageu2019s ($DOWI) 12% gains during the same time frame.
n
nn
Shares of EQT fell 5.4% on a YTD basis and dipped 14.6% over the past 52 weeks, underperforming DOWIu2019s YTD gains of 7.3% and 22.3% returns over the last year.
n
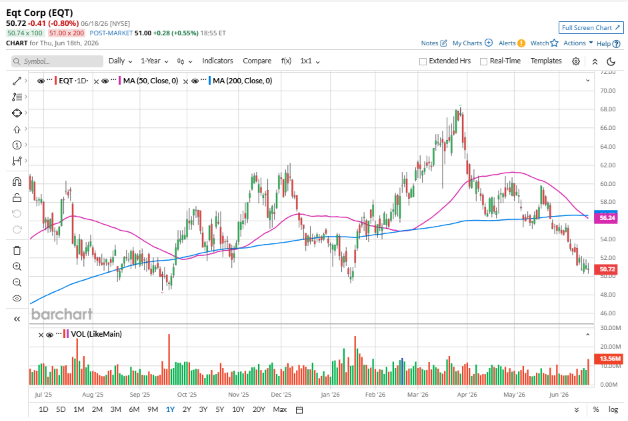
To confirm the bearish trend, EQT has been trading below its 200-day moving average since late May. The stock is trading below its 50-day moving average since early April, with slight fluctuations.
n
nn
On Apr. 21, EQT reported its Q1 results, and its shares closed up more than 3% in the following trading session. Its revenue stood at $3.4 billion, up 94.2% year over year. The companyu2019s adjusted EPS increased 97.5% from the year-ago quarter to $2.33.
n
In the competitive arena of oil & gas E&P, Diamondback Energy, Inc. (FANG) has taken the lead over EQT, showing resilience with a 22.1% uptick on a YTD basis and solid 23.3% gains over the past 52 weeks.
n
Wall Street analysts are bullish on EQTu2019s prospects. The stock has a consensus u201cStrong Buyu201d rating from the 25 analysts covering it, and the mean price target of $69.87 suggests a notable potential upside of 37.8% from current price levels.
On the date of publication, Neha Panjwani did not have (either directly or indirectly) positions in any of the securities mentioned in this article. All information and data in this article is solely for informational purposes. For more information please view the Barchart Disclosure Policy here. “,”symbols”:[“FANG”,”EQT”,”$DOWI”],”related”:[{“id”:”2563887″,”title”:”CF Industries Stock: Is CF Underperforming the Materials Sector?”,”slug”:”cf-industries-stock-is-cf-underperforming-the-materials-sector”,”feedName”:”Barchart”,”published”:”Sat Jun 20, 12:07AM CDT”,”categories”:[“STK.EQY”]},{“id”:”2563536″,”title”:”Is Pool Corporation Stock Underperforming the Nasdaq?”,”slug”:”is-pool-corporation-stock-underperforming-the-nasdaq”,”feedName”:”Barchart”,”published”:”Fri Jun 19, 9:56PM CDT”,”categories”:[“STK.EQY”]},{“id”:”2562883″,”title”:”Is Robinhood Markets Stock Outperforming the S&P 500?”,”slug”:”is-robinhood-markets-stock-outperforming-the-sp-500″,”feedName”:”Barchart”,”published”:”Fri Jun 19, 7:20PM CDT”,”categories”:[“STK.EQY”]},{“id”:”2558604″,”title”:”Is MGM Resorts International Stock Outperforming the S&P 500?”,”slug”:”is-mgm-resorts-international-stock-outperforming-the-sp-500″,”feedName”:”Barchart”,”published”:”Fri Jun 19, 12:10PM CDT”,”categories”:[“STK.EQY”]},{“id”:”2558557″,”title”:”Is Evergy Stock Underperforming the Nasdaq?”,”slug”:”is-evergy-stock-underperforming-the-nasdaq”,”feedName”:”Barchart”,”published”:”Fri Jun 19, 12:03PM CDT”,”categories”:[“STK.EQY”]},{“id”:”2558000″,”title”:”Insulet Corporation Stock: Is PODD Underperforming the Healthcare Sector?”,”slug”:”insulet-corporation-stock-is-podd-underperforming-the-healthcare-sector”,”feedName”:”Barchart”,”published”:”Fri Jun 19, 11:08AM CDT”,”categories”:[“STK.EQY”]},{“id”:”2557844″,”title”:”How Is Healthpeak Properties’ Stock Performance Compared to Other Real Estate Stocks?”,”slug”:”how-is-healthpeak-properties-stock-performance-compared-to-other-real-estate-stocks”,”feedName”:”Barchart”,”published”:”Fri Jun 19, 10:55AM CDT”,”categories”:[“STK.EQY”]},{“id”:”2557838″,”title”:”Is Franklin Resources Stock Outperforming the Dow?”,”slug”:”is-franklin-resources-stock-outperforming-the-dow”,”feedName”:”Barchart”,”published”:”Fri Jun 19, 10:55AM CDT”,”categories”:[“STK.EQY”]},{“id”:”2557384″,”title”:”How Is Steel Dynamicsu2019 Stock Performance Compared to Other Steel Stocks?”,”slug”:”how-is-steel-dynamics-stock-performance-compared-to-other-steel-stocks”,”feedName”:”Barchart”,”published”:”Fri Jun 19, 10:22AM CDT”,”categories”:[“STK.EQY”]}],”sourceId”:”10953646″,”media”:”text”,”thumbnail”:{“url”:”https://media.barchart.com/contributors-admin/common-images/images/Stocks%2C%20Markets%2C%20%26%20Global%20Economy/Charts%2C%20tickers%2C%20traders/3d%20illustration%20inflation%20and%20deflation%20graph%20by%20Deepadesigns%20via%20Shutterstock.jpg”,”width”:1600,”height”:1067,”caption”:”3d illustration inflation and deflation graph by Deepadesigns via Shutterstock”},”summary”:”EQT Corporation has underperformed the Dow over the past year, but analysts are highly optimistic about the stocku2019s prospects.”,”canonicalUrl”:”https://www.barchart.com/story/news/2556653/is-eqt-corporation-stock-underperforming-the-dow”,”slug”:”is-eqt-corporation-stock-underperforming-the-dow”,”sourceFeed”:”CONT2″,”categories”:[“FUT.ENG”,”STK.EQY”,”STK.IND.ENG”],”meta”:null,”authorBadge”:null},”barchartAuthor”:{“id”:0,”following”:false},”contributorsServiceCategories”:[“Energy”,”Equities/Stocks”],”isBarchartAuthor”:true,”isContributorOrSyndicated”:false,”isPressRelease”:false,”isSponsoredContent”:false,”shouldLoadMoreNews”:true,”displayCaption”:true,”isFuturesArticle”:true,”shouldTruncateContent”:false,”shareLink”:”https://www.barchart.com/share/news/2556653/is-eqt-corporation-stock-underperforming-the-dow”}” data-ng-controller=”NewsItem.newsItemCtrl as vm” data-ng-init=”shareLink=’https://www.barchart.com/share/news/2556653/is-eqt-corporation-stock-underperforming-the-dow'”>
Neha Panjwani – Barchart – Columnist
All information and data in this article is solely for informational purposes. For more information please view the Barchart Disclosure Policy here
![]()
![]()

3d illustration inflation and deflation graph by Deepadesigns via Shutterstock
EQT Corporation (EQT), headquartered in Pittsburgh, Pennsylvania, operates as a natural gas production company. With a market cap of $32 billion, EQT is an integrated energy company with emphasis on Appalachian area natural-gas supply, transmission, and distribution, offering its products to wholesale and retail customers.
Companies worth $10 billion or more are generally described as “large-cap stocks,” and EQT perfectly fits that description, with its market cap exceeding this mark, underscoring its size, influence, and dominance within the oil & gas E&P industry. EQT’s strength lies in its status as a foundational player in global Oil & Gas E&P. Under its leadership team, the company executes a disciplined multi-year strategy that pairs growth investment with consistent shareholder returns.
Despite its notable strength, EQT slipped 25.7% from its 52-week high of $68.24, achieved on Mar. 27. Over the past three months, EQT stock has declined 20.2%, underperforming the Dow Jones Industrials Average’s ($DOWI) 12% gains during the same time frame.

Shares of EQT fell 5.4% on a YTD basis and dipped 14.6% over the past 52 weeks, underperforming DOWI’s YTD gains of 7.3% and 22.3% returns over the last year.
To confirm the bearish trend, EQT has been trading below its 200-day moving average since late May. The stock is trading below its 50-day moving average since early April, with slight fluctuations.

On Apr. 21, EQT reported its Q1 results, and its shares closed up more than 3% in the following trading session. Its revenue stood at $3.4 billion, up 94.2% year over year. The company’s adjusted EPS increased 97.5% from the year-ago quarter to $2.33.
In the competitive arena of oil & gas E&P, Diamondback Energy, Inc. (FANG) has taken the lead over EQT, showing resilience with a 22.1% uptick on a YTD basis and solid 23.3% gains over the past 52 weeks.
Wall Street analysts are bullish on EQT’s prospects. The stock has a consensus “Strong Buy” rating from the 25 analysts covering it, and the mean price target of $69.87 suggests a notable potential upside of 37.8% from current price levels.
On the date of publication, Neha Panjwani did not have (either directly or indirectly) positions in any of the securities mentioned in this article. All information and data in this article is solely for informational purposes. For more information please view the Barchart Disclosure Policy here.