n
Companies valued at $10 billion or more are generally classified as u201clarge-capu201d stocks, and Quest Diagnostics fits this criterion perfectly, exceeding the mark. Quest focuses on accelerating growth through strategic partnerships and innovation, while driving operational excellence across its customer value chain and IT infrastructure.
n
Despite this, shares of the Secaucus, New Jersey-based company have declined 8.7% from its 52-week high of $213.50. DGX stock has fallen marginally over the past three months, lagging behind the S&P 500 Indexu2019s ($SPX) 13.2% increase over the same time frame.
n
 n
nn
In the longer term, shares of Quest Diagnostics have risen 8.5% over the past 52 weeks, underperforming the 25.4% return of the SPX over the same time frame. However, the stock is up 12.4% on a YTD basis, exceeding SPXu2019s 9.6% gain.
n
The stock has been trading above its 200-day moving average since last year.
n
 n
nn
Shares of Quest Diagnostics rose 4.5% on Apr. 21 after the company reported strong Q1 2026 results, with revenue increasing 9.2% year-over-year to $2.9 billion, including 9% organic revenue growth, while reported adjusted diluted EPS increased 13.1% to $2.50. Investors were encouraged by broad-based growth across the business, including robust consumer-channel performance through QuestHealth, double-digit growth in several Advanced Diagnostics categories, and continued expansion of strategic partnerships and laboratory services.
n
The stock gained further support after management raised its full-year 2026 outlook, forecasting adjusted diluted EPS of $10.63 – $10.83.
n
In comparison, rival Thermo Fisher Scientific Inc. (TMO) has lagged behind DGX stock on a YTD basis, with TMO stock declining 19.8%. Nevertheless, TMO stock has gained 18.4% over the past year, outpacing DGX stock.
n
Despite the stocku2019s underperformance over the past year, analysts remain moderately optimistic on DGX. The stock has a consensus rating of u201cModerate Buyu201d from 18 analysts in coverage, and the mean price target of $223 is a premium of 14.4% to current levels.
On the date of publication, Sohini Mondal did not have (either directly or indirectly) positions in any of the securities mentioned in this article. All information and data in this article is solely for informational purposes. For more information please view the Barchart Disclosure Policy here. “,”symbols”:[{“symbol”:”DGX”,”symbolName”:”Quest Diagnostics Inc”,”symbolType”:1,”lastPrice”:”195.00″,”priceChange”:”-2.76″,”percentChange”:”-1.40%”},{“symbol”:”$SPX”,”symbolName”:”S&P 500 Index”,”symbolType”:9,”lastPrice”:”7,500.58″,”priceChange”:”unch”,”percentChange”:”unch”},{“symbol”:”TMO”,”symbolName”:”Thermo Fisher Scientific”,”symbolType”:1,”lastPrice”:”464.61″,”priceChange”:”+2.92″,”percentChange”:”+0.63%”}],”related”:[{“id”:”2563887″,”title”:”CF Industries Stock: Is CF Underperforming the Materials Sector?”,”slug”:”cf-industries-stock-is-cf-underperforming-the-materials-sector”,”feedName”:”Barchart”,”published”:”Sat Jun 20, 12:07AM CDT”,”categories”:[“STK.EQY”]},{“id”:”2563536″,”title”:”Is Pool Corporation Stock Underperforming the Nasdaq?”,”slug”:”is-pool-corporation-stock-underperforming-the-nasdaq”,”feedName”:”Barchart”,”published”:”Fri Jun 19, 9:56PM CDT”,”categories”:[“STK.EQY”]},{“id”:”2562883″,”title”:”Is Robinhood Markets Stock Outperforming the S&P 500?”,”slug”:”is-robinhood-markets-stock-outperforming-the-sp-500″,”feedName”:”Barchart”,”published”:”Fri Jun 19, 7:20PM CDT”,”categories”:[“STK.EQY”]},{“id”:”2558604″,”title”:”Is MGM Resorts International Stock Outperforming the S&P 500?”,”slug”:”is-mgm-resorts-international-stock-outperforming-the-sp-500″,”feedName”:”Barchart”,”published”:”Fri Jun 19, 12:10PM CDT”,”categories”:[“STK.EQY”]},{“id”:”2558557″,”title”:”Is Evergy Stock Underperforming the Nasdaq?”,”slug”:”is-evergy-stock-underperforming-the-nasdaq”,”feedName”:”Barchart”,”published”:”Fri Jun 19, 12:03PM CDT”,”categories”:[“STK.EQY”]},{“id”:”2558000″,”title”:”Insulet Corporation Stock: Is PODD Underperforming the Healthcare Sector?”,”slug”:”insulet-corporation-stock-is-podd-underperforming-the-healthcare-sector”,”feedName”:”Barchart”,”published”:”Fri Jun 19, 11:08AM CDT”,”categories”:[“STK.EQY”]},{“id”:”2557844″,”title”:”How Is Healthpeak Properties’ Stock Performance Compared to Other Real Estate Stocks?”,”slug”:”how-is-healthpeak-properties-stock-performance-compared-to-other-real-estate-stocks”,”feedName”:”Barchart”,”published”:”Fri Jun 19, 10:55AM CDT”,”categories”:[“STK.EQY”]},{“id”:”2557838″,”title”:”Is Franklin Resources Stock Outperforming the Dow?”,”slug”:”is-franklin-resources-stock-outperforming-the-dow”,”feedName”:”Barchart”,”published”:”Fri Jun 19, 10:55AM CDT”,”categories”:[“STK.EQY”]},{“id”:”2557384″,”title”:”How Is Steel Dynamicsu2019 Stock Performance Compared to Other Steel Stocks?”,”slug”:”how-is-steel-dynamics-stock-performance-compared-to-other-steel-stocks”,”feedName”:”Barchart”,”published”:”Fri Jun 19, 10:22AM CDT”,”categories”:[“STK.EQY”]}],”sourceId”:”10950084″,”media”:”text”,”thumbnail”:{“url”:”https://media.barchart.com/contributors-admin/common-images/images/Stocks%2C%20Markets%2C%20%26%20Global%20Economy/Charts%2C%20tickers%2C%20traders/Desktop%20and%20Mobile%20Trading%20by%20rawf8%20via%20Shutterstock.jpg”,”width”:1600,”height”:970,”caption”:”Desktop and Mobile Trading by rawf8 via Shutterstock”},”summary”:”While Quest Diagnostics has lagged behind the S&P 500 Index over the past year, analysts are moderately optimistic about the stocku2019s prospects.”,”canonicalUrl”:”https://www.barchart.com/story/news/2548982/is-quest-diagnostics-stock-underperforming-the-s-p-500″,”slug”:”is-quest-diagnostics-stock-underperforming-the-sp-500″,”sourceFeed”:”CONT2″,”categories”:[“STK.EQY”],”meta”:”N/A”,”authorBadge”:null,”raw”:{“id”:”2548982″,”title”:”Is Quest Diagnostics Stock Underperforming the S&P 500?”,”author”:”Sohini Mondal”,”authorUrl”:”https://www.barchart.com/news/authors/410/sohini-mondal”,”authorImage”:”https://media.barchart.com/news/authors/410/avatar-LrIxJrAo6KPyxuT5.png”,”authorType”:”author”,”feed”:”SANDP”,”originalFeed”:null,”feedName”:”Barchart”,”feedUrl”:”https://www.barchart.com”,”published”:1781838718,”publishedTime”:”2026-06-19 03:11:58″,”updated”:”2026-06-19 03:11:58 +0000″,”image”:{“url”:”https://media.barchart.com/contributors-admin/common-images/images/Stocks%2C%20Markets%2C%20%26%20Global%20Economy/Charts%2C%20tickers%2C%20traders/Desktop%20and%20Mobile%20Trading%20by%20rawf8%20via%20Shutterstock.jpg”,”width”:1600,”height”:970,”caption”:”Desktop and Mobile Trading by rawf8 via Shutterstock”},”content”:”
With a market cap of $21.9 billion, Quest Diagnostics Incorporated (DGX) is a leading provider of diagnostic testing services in the United States and internationally. The company operates through two primary business groups – Diagnostic Information Services and Diagnostic Solutions, serving a wide range of clients including physicians, hospitals, insurers, and government agencies.
n
Companies valued at $10 billion or more are generally classified as u201clarge-capu201d stocks, and Quest Diagnostics fits this criterion perfectly, exceeding the mark. Quest focuses on accelerating growth through strategic partnerships and innovation, while driving operational excellence across its customer value chain and IT infrastructure.
n
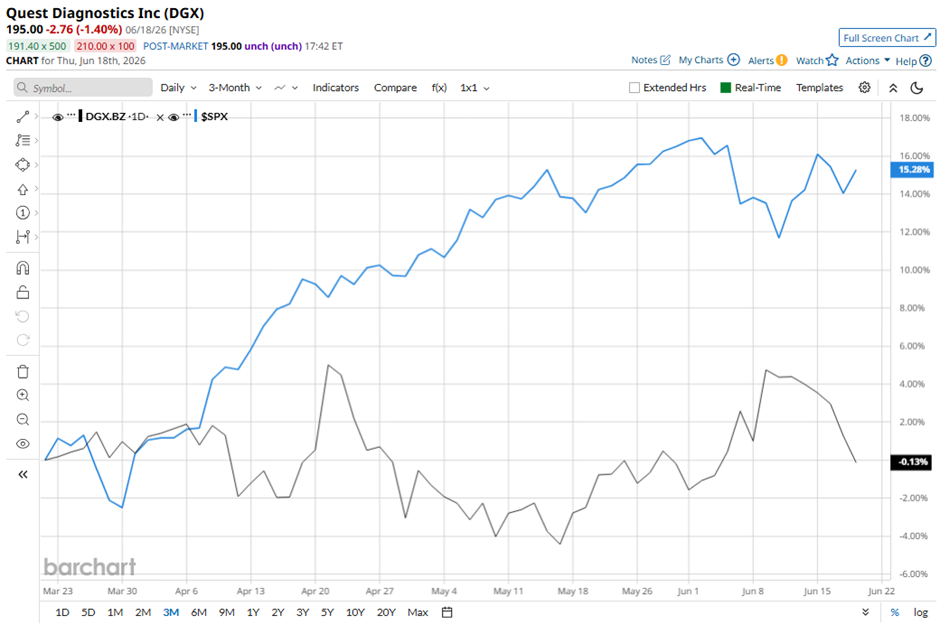
Despite this, shares of the Secaucus, New Jersey-based company have declined 8.7% from its 52-week high of $213.50. DGX stock has fallen marginally over the past three months, lagging behind the S&P 500 Indexu2019s ($SPX) 13.2% increase over the same time frame.
n
nn
In the longer term, shares of Quest Diagnostics have risen 8.5% over the past 52 weeks, underperforming the 25.4% return of the SPX over the same time frame. However, the stock is up 12.4% on a YTD basis, exceeding SPXu2019s 9.6% gain.
n
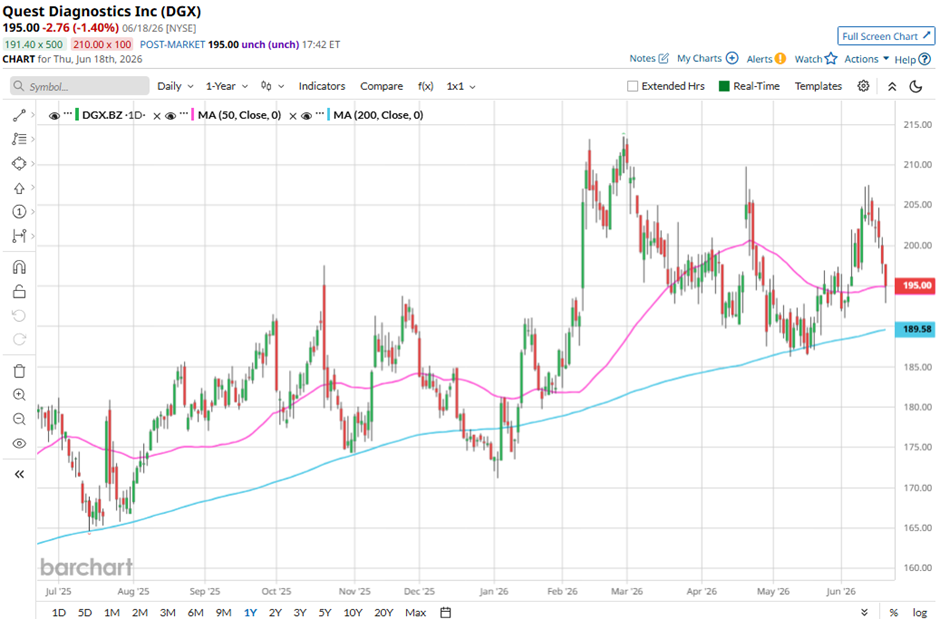
The stock has been trading above its 200-day moving average since last year.
n
nn
Shares of Quest Diagnostics rose 4.5% on Apr. 21 after the company reported strong Q1 2026 results, with revenue increasing 9.2% year-over-year to $2.9 billion, including 9% organic revenue growth, while reported adjusted diluted EPS increased 13.1% to $2.50. Investors were encouraged by broad-based growth across the business, including robust consumer-channel performance through QuestHealth, double-digit growth in several Advanced Diagnostics categories, and continued expansion of strategic partnerships and laboratory services.
n
The stock gained further support after management raised its full-year 2026 outlook, forecasting adjusted diluted EPS of $10.63 – $10.83.
n
In comparison, rival Thermo Fisher Scientific Inc. (TMO) has lagged behind DGX stock on a YTD basis, with TMO stock declining 19.8%. Nevertheless, TMO stock has gained 18.4% over the past year, outpacing DGX stock.
n
Despite the stocku2019s underperformance over the past year, analysts remain moderately optimistic on DGX. The stock has a consensus rating of u201cModerate Buyu201d from 18 analysts in coverage, and the mean price target of $223 is a premium of 14.4% to current levels.
On the date of publication, Sohini Mondal did not have (either directly or indirectly) positions in any of the securities mentioned in this article. All information and data in this article is solely for informational purposes. For more information please view the Barchart Disclosure Policy here. “,”symbols”:[“DGX”,”$SPX”,”TMO”],”related”:[{“id”:”2563887″,”title”:”CF Industries Stock: Is CF Underperforming the Materials Sector?”,”slug”:”cf-industries-stock-is-cf-underperforming-the-materials-sector”,”feedName”:”Barchart”,”published”:”Sat Jun 20, 12:07AM CDT”,”categories”:[“STK.EQY”]},{“id”:”2563536″,”title”:”Is Pool Corporation Stock Underperforming the Nasdaq?”,”slug”:”is-pool-corporation-stock-underperforming-the-nasdaq”,”feedName”:”Barchart”,”published”:”Fri Jun 19, 9:56PM CDT”,”categories”:[“STK.EQY”]},{“id”:”2562883″,”title”:”Is Robinhood Markets Stock Outperforming the S&P 500?”,”slug”:”is-robinhood-markets-stock-outperforming-the-sp-500″,”feedName”:”Barchart”,”published”:”Fri Jun 19, 7:20PM CDT”,”categories”:[“STK.EQY”]},{“id”:”2558604″,”title”:”Is MGM Resorts International Stock Outperforming the S&P 500?”,”slug”:”is-mgm-resorts-international-stock-outperforming-the-sp-500″,”feedName”:”Barchart”,”published”:”Fri Jun 19, 12:10PM CDT”,”categories”:[“STK.EQY”]},{“id”:”2558557″,”title”:”Is Evergy Stock Underperforming the Nasdaq?”,”slug”:”is-evergy-stock-underperforming-the-nasdaq”,”feedName”:”Barchart”,”published”:”Fri Jun 19, 12:03PM CDT”,”categories”:[“STK.EQY”]},{“id”:”2558000″,”title”:”Insulet Corporation Stock: Is PODD Underperforming the Healthcare Sector?”,”slug”:”insulet-corporation-stock-is-podd-underperforming-the-healthcare-sector”,”feedName”:”Barchart”,”published”:”Fri Jun 19, 11:08AM CDT”,”categories”:[“STK.EQY”]},{“id”:”2557844″,”title”:”How Is Healthpeak Properties’ Stock Performance Compared to Other Real Estate Stocks?”,”slug”:”how-is-healthpeak-properties-stock-performance-compared-to-other-real-estate-stocks”,”feedName”:”Barchart”,”published”:”Fri Jun 19, 10:55AM CDT”,”categories”:[“STK.EQY”]},{“id”:”2557838″,”title”:”Is Franklin Resources Stock Outperforming the Dow?”,”slug”:”is-franklin-resources-stock-outperforming-the-dow”,”feedName”:”Barchart”,”published”:”Fri Jun 19, 10:55AM CDT”,”categories”:[“STK.EQY”]},{“id”:”2557384″,”title”:”How Is Steel Dynamicsu2019 Stock Performance Compared to Other Steel Stocks?”,”slug”:”how-is-steel-dynamics-stock-performance-compared-to-other-steel-stocks”,”feedName”:”Barchart”,”published”:”Fri Jun 19, 10:22AM CDT”,”categories”:[“STK.EQY”]}],”sourceId”:”10950084″,”media”:”text”,”thumbnail”:{“url”:”https://media.barchart.com/contributors-admin/common-images/images/Stocks%2C%20Markets%2C%20%26%20Global%20Economy/Charts%2C%20tickers%2C%20traders/Desktop%20and%20Mobile%20Trading%20by%20rawf8%20via%20Shutterstock.jpg”,”width”:1600,”height”:970,”caption”:”Desktop and Mobile Trading by rawf8 via Shutterstock”},”summary”:”While Quest Diagnostics has lagged behind the S&P 500 Index over the past year, analysts are moderately optimistic about the stocku2019s prospects.”,”canonicalUrl”:”https://www.barchart.com/story/news/2548982/is-quest-diagnostics-stock-underperforming-the-s-p-500″,”slug”:”is-quest-diagnostics-stock-underperforming-the-sp-500″,”sourceFeed”:”CONT2″,”categories”:[“STK.EQY”],”meta”:null,”authorBadge”:null},”barchartAuthor”:{“id”:0,”following”:false},”contributorsServiceCategories”:[“Equities/Stocks”],”isBarchartAuthor”:true,”isContributorOrSyndicated”:false,”isPressRelease”:false,”isSponsoredContent”:false,”shouldLoadMoreNews”:true,”displayCaption”:true,”isFuturesArticle”:false,”shouldTruncateContent”:false,”shareLink”:”https://www.barchart.com/share/news/2548982/is-quest-diagnostics-stock-underperforming-the-sp-500″}” data-ng-controller=”NewsItem.newsItemCtrl as vm” data-ng-init=”shareLink=’https://www.barchart.com/share/news/2548982/is-quest-diagnostics-stock-underperforming-the-sp-500′”>
Sohini Mondal – Barchart – Columnist
All information and data in this article is solely for informational purposes. For more information please view the Barchart Disclosure Policy here
![]()
![]()

Desktop and Mobile Trading by rawf8 via Shutterstock
With a market cap of $21.9 billion, Quest Diagnostics Incorporated (DGX) is a leading provider of diagnostic testing services in the United States and internationally. The company operates through two primary business groups – Diagnostic Information Services and Diagnostic Solutions, serving a wide range of clients including physicians, hospitals, insurers, and government agencies.
Companies valued at $10 billion or more are generally classified as “large-cap” stocks, and Quest Diagnostics fits this criterion perfectly, exceeding the mark. Quest focuses on accelerating growth through strategic partnerships and innovation, while driving operational excellence across its customer value chain and IT infrastructure.
Despite this, shares of the Secaucus, New Jersey-based company have declined 8.7% from its 52-week high of $213.50. DGX stock has fallen marginally over the past three months, lagging behind the S&P 500 Index’s ($SPX) 13.2% increase over the same time frame.
In the longer term, shares of Quest Diagnostics have risen 8.5% over the past 52 weeks, underperforming the 25.4% return of the SPX over the same time frame. However, the stock is up 12.4% on a YTD basis, exceeding SPX’s 9.6% gain.
The stock has been trading above its 200-day moving average since last year.
Shares of Quest Diagnostics rose 4.5% on Apr. 21 after the company reported strong Q1 2026 results, with revenue increasing 9.2% year-over-year to $2.9 billion, including 9% organic revenue growth, while reported adjusted diluted EPS increased 13.1% to $2.50. Investors were encouraged by broad-based growth across the business, including robust consumer-channel performance through QuestHealth, double-digit growth in several Advanced Diagnostics categories, and continued expansion of strategic partnerships and laboratory services.
The stock gained further support after management raised its full-year 2026 outlook, forecasting adjusted diluted EPS of $10.63 – $10.83.
In comparison, rival Thermo Fisher Scientific Inc. (TMO) has lagged behind DGX stock on a YTD basis, with TMO stock declining 19.8%. Nevertheless, TMO stock has gained 18.4% over the past year, outpacing DGX stock.
Despite the stock’s underperformance over the past year, analysts remain moderately optimistic on DGX. The stock has a consensus rating of “Moderate Buy” from 18 analysts in coverage, and the mean price target of $223 is a premium of 14.4% to current levels.
On the date of publication, Sohini Mondal did not have (either directly or indirectly) positions in any of the securities mentioned in this article. All information and data in this article is solely for informational purposes. For more information please view the Barchart Disclosure Policy here.