

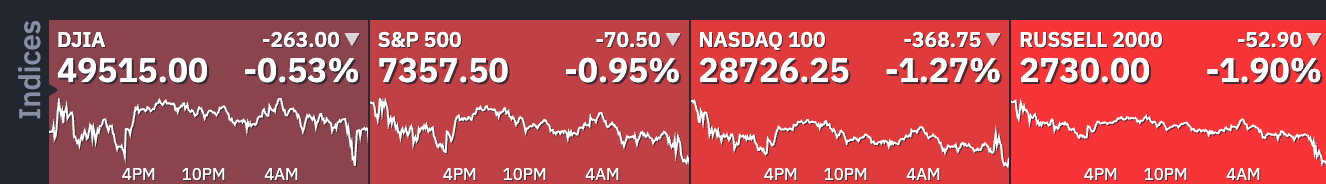
- After their ceaseless rally, Semiconductors and Mag 7s are pulling back, imposing a stop in Stock Markets euphoria
- Feeling the pressure of the spike in yields, the Warsh Trade could prove more dangerous for overextended Tech-heavy Stock Markets
- Exploring Technical Levels for the Dow Jones, Nasdaq and S&P 500
Stock markets have surged since the peak of the US-Iran conflict, but this strong trend is finally starting to slow down. After weeks of pushing the market higher, semiconductor giants and the Magnificent 7 are now pulling back, putting a sudden stop to the recent Wall Street excitement.
Geopolitical tensions are still unresolved, and the market’s optimism is fading. Even though yesterday saw a big relief rally after news broke that planned US military attacks on Iran were halted, investors could not keep up the positive momentum today.
The lack of immediate conflict is no longer enough to hide changing economic conditions, and particularly when it comes to Fed expectations.
Now, stocks are under pressure from a sharp rise in bond yields. The new Warsh Trade is especially risky for tech-heavy sectors that have grown too quickly.
With Kevin Warsh confirmed to become the next Federal Reserve Chairman and likely to reduce the central bank’s balance sheet, less liquidity is causing investors to rethink the current extreme pricing of high-growth assets – We will learn more on his views this Friday, date he will be sworn in.
As a result, the strong upward trend that has kept the Nasdaq and S&P 500 rising since early April is now breaking down – But for now, the correction remains quite contained.
With the main drivers of the rally now leading the decline, traders are left wondering if the big peace rally has come to an end.
Breaking News: The US President mentioned that he could potentially lean back into attacks on Iran! Make sure to track the latest narrative on the conflict throughout the week.
Let’s get ready for a potentially rocky action ahead by diving into intraday charts and trading levels for the Dow Jones Industrial Average, Nasdaq Composite, and S&P 500.
Current Session’s Stock Heatmap
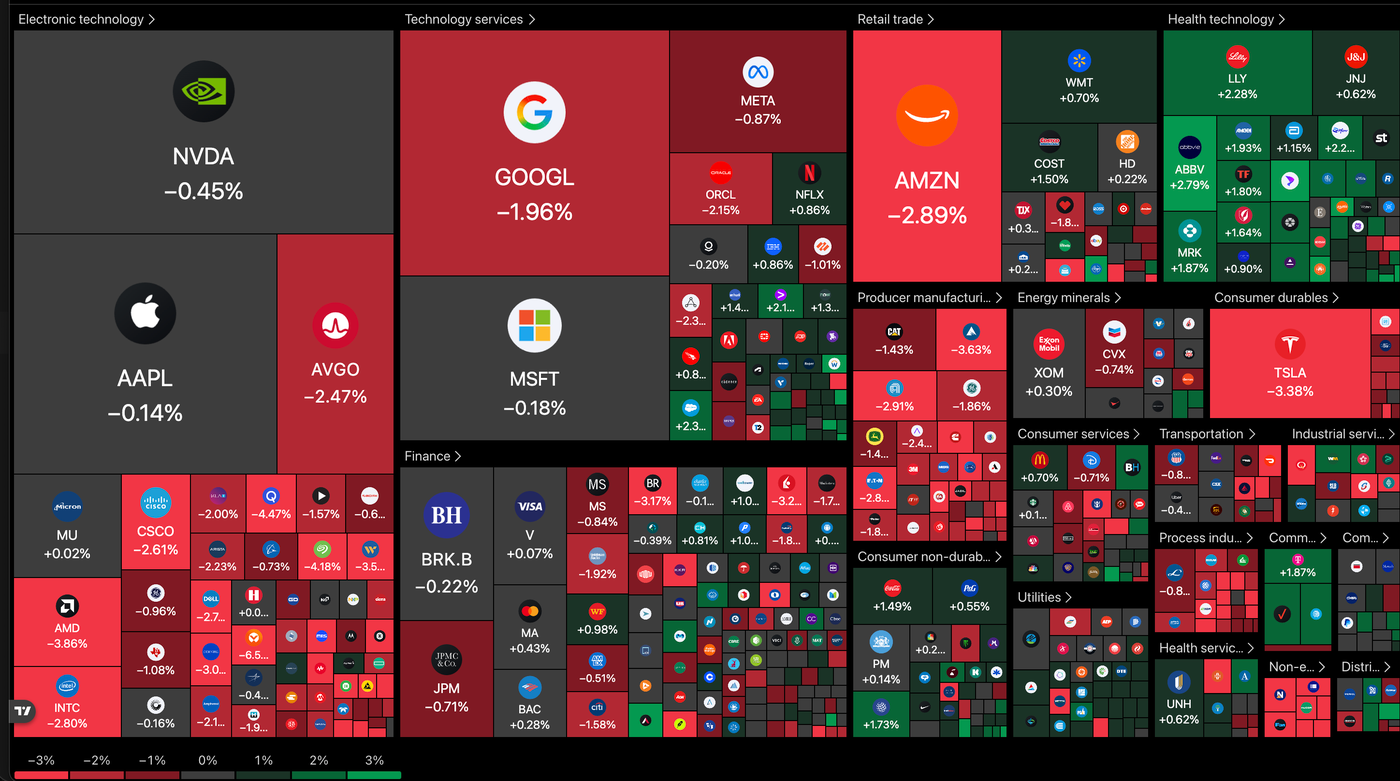
As you can see, the Stock Market split continues, with ongoing rebalancing and profit-taking from Semiconductors, Tech, and Magnificent 7s, leading the pullback in Nasdaq and S&P 500 while Healthcare remains the most bid sector, helping the DJIA to resist the selloff with more tenacity than its peers.
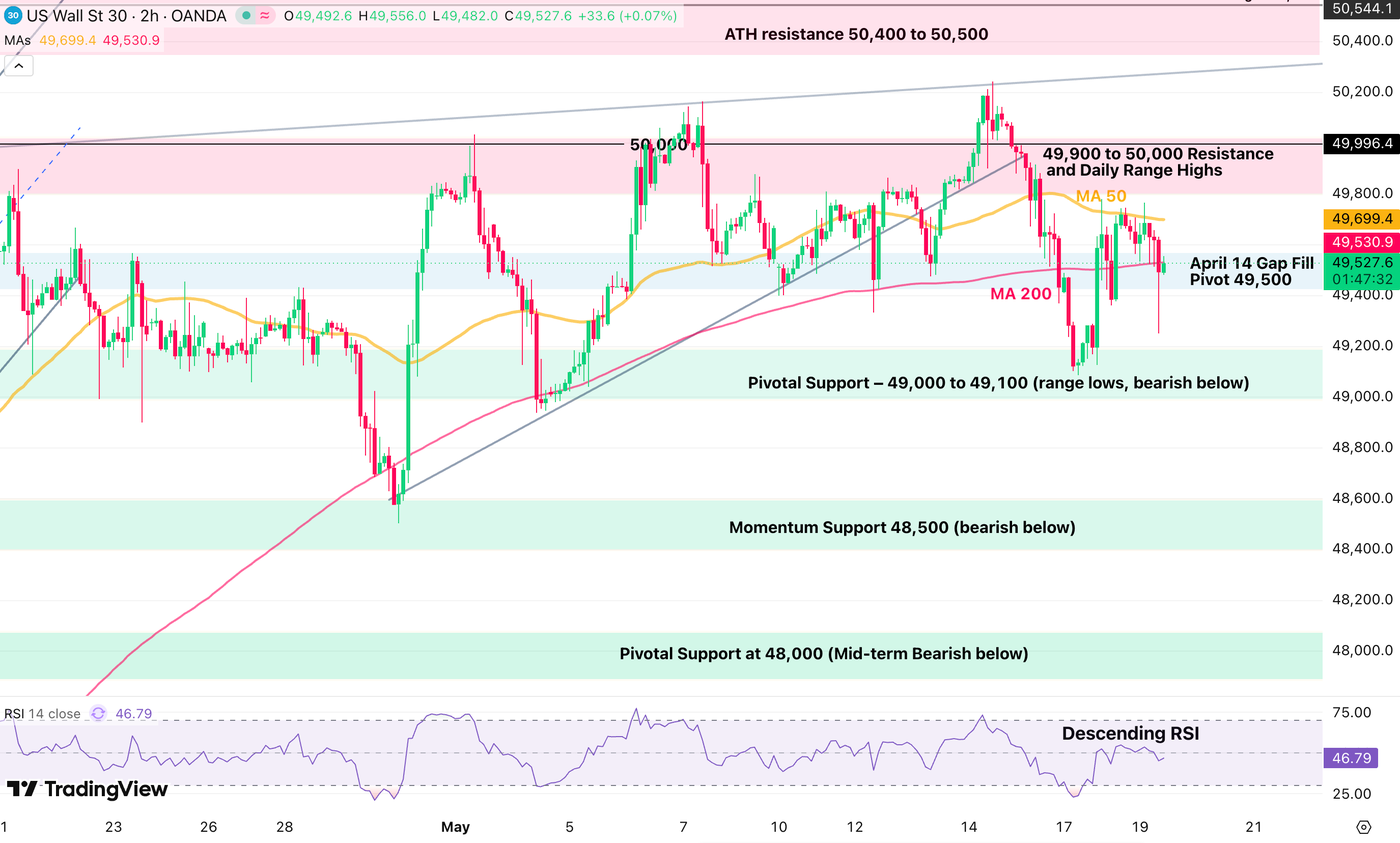
Dow Jones 2H Chart and Trading Levels
After the latest trump comments, the action in Stocks showed a quick wick to the downside but bulls quickly re-entered to fade the move, but a selling wave its making its quick re-apparition.
TACO or not, the threat remains a large one for Stock Markets, particularly traditional sectors, hence it will be important to keep track of the latest War narratives to see if these are only words or the prelude to something much worse.
Still, the Dow Jones maintains its solid range between 49,000 and 49,900, largely resilient to the outflows seen in other indexes. Keep a close eye on the two range bounds for potential breakouts (with stop orders being a potentially interesting way to enter any buying/selling wave).
Dow Jones technical levels for trading:
Resistance Levels
- 2H 200-MA (49,500)
- 49,900 to 50,000 Resistance and Early 2026 Highs (range top)
- ATH resistance 50,400 to 50,500
- All-Time Highs 50,544
Support Levels
- Major Pivot – 49,000 to 49,100 (range lows)
- Momentum Support 48,500
- Pivotal Support at 48,000 (mid-term bearish below)
- Mini Support 47,400 to 47,600
Nasdaq 2H Chart and Trading Levels
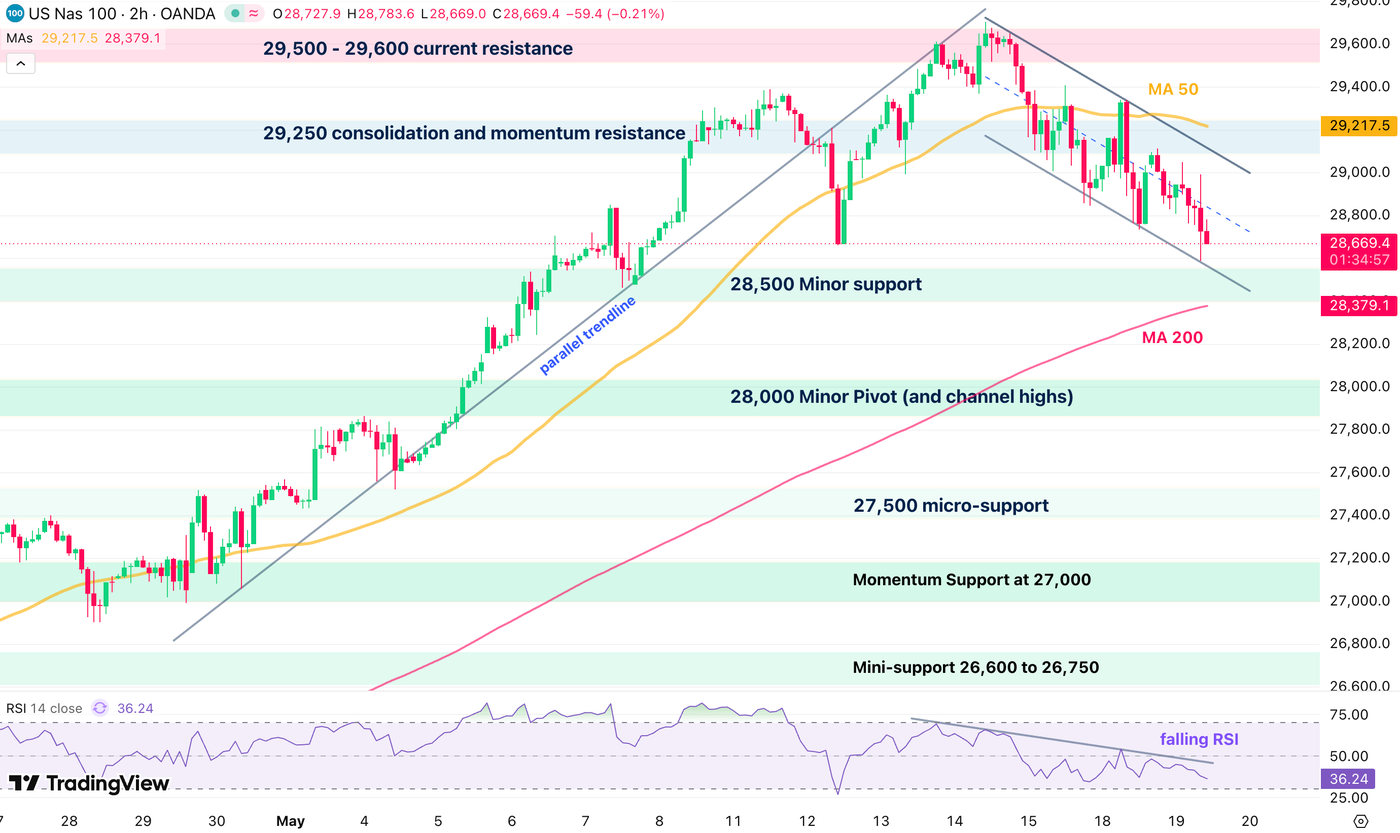
Nasdaq is now embarking into a more significant pullback, forming a bear channel in its latest action.
Still, the pullback technically looks healthy for now, so Bulls will want to watch reactions at the 28,500 support.
Any break of that support however could open the way for a larger correction (~26,300, past ATH) particularly if the mood sours until then.
Nasdaq technical levels of interest:
Resistance Levels
- 28,900 mini intraday resistance
- 29,250 consolidation and momentum pivot
- 29,218 2H 50-period MA
- 29,500 – 29,600 current resistance (ATH)
Support Levels
- 28,500 Minor support
- 28,000 Major psychological resistance now Pivot (and channel highs)
- 27,500 micro-support
- Prior ATH Support 26,200 to 26,300
S&P 500 2H Chart and Trading Levels
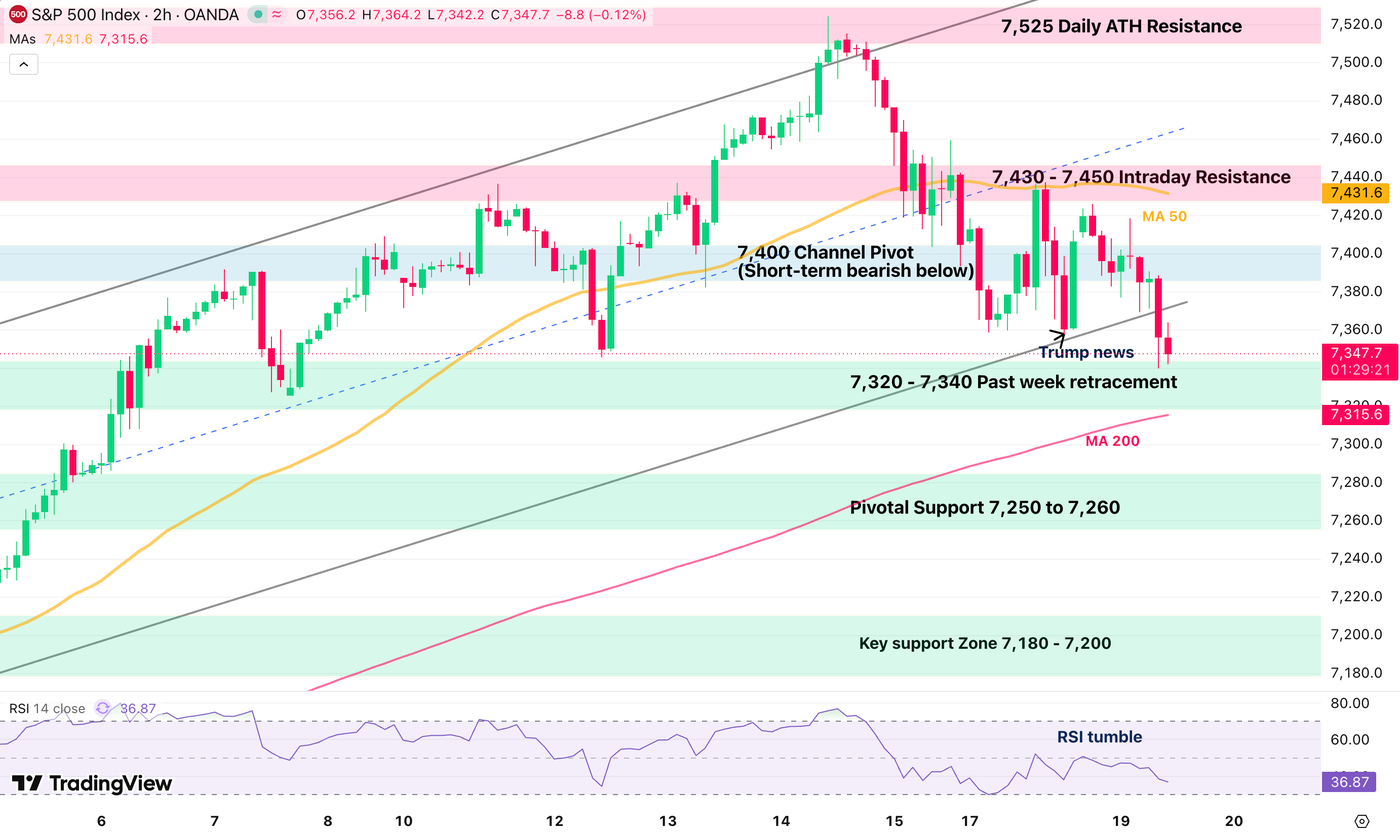
After the past week’s fake-out above the key bull channel, the S&P 500 is breaking to the downside.
Buyers are stepping in right at the past week’s support and attempting a push, but the action still looks quite unsure around current levels.
To get a better idea of where to look next, traders will want to see:
- A bullish impulse and 4H close above 7,380 for the bulls to retake the channel
- For bears, either a rejection of the support (break below 7,320) or a break-retest of the channel (hence a rejection of 7,370)
S&P 500 technical levels of interest:
Resistance Levels
- 7,400 Channel Pivot (Short-term bearish below)
- 7,430 – 7,450 Intraday Resistance
- 7,525 Daily ATH Resistance
Support Levels
- 7,320 to 7,340 Past week retracement (and Channel lows)
- Pivotal Support 7,250 to 7,260
- Prior ATH Pivot 7,000 to 7,020
- Minor Support 6,880 to 6,900
- Pivotal Support 6,750 to 6,770
- 6,300 psychological level (War lows)
Keep track of WTI Crude and the latest headlines throughout the week to stay ahead of the game.
Safe Trades!
Follow Elior on Twitter/X for Additional Market News, interactions and Insights @EliorManier
Opinions are the authors’; not necessarily that of OANDA Business Information & Services, Inc. or any of its affiliates, subsidiaries, officers or directors. The provided publication is for informational and educational purposes only.
If you would like to reproduce or redistribute any of the content found on MarketPulse, an award winning forex, commodities and global indices analysis and news site service produced by OANDA Business Information & Services, Inc., please refer to the MarketPulse Terms of Use.
Visit https://www.marketpulse.com/ to find out more about the beat of the global markets.
© 2026 OANDA Business Information & Services Inc.
About the Author

Elior Manier
Market Analyst
Elior brings over seven years of experience in financial markets to our analyst team. Since 2018, he has actively engaged in observing, charting, and trading, driven by his passion for mastering market dynamics. With a profound understanding of the geopolitical and macroeconomic forces that shape market movements, Elior focuses on analysing the impact of breaking news, market sentiment, and critical economic data releases on trading flows.
As a versatile analyst, he contributes powerful insights to the team, effectively integrating geopolitical and technical analysis to provide clear and comprehensive market perspectives.
Prior to joining our team, Elior honed his expertise as a Fixed Income Trader and Market Analyst at the Montreal Exchange.