
Companies worth $10 billion or more are generally described as u201clarge-cap stocks,u201d and WMB perfectly fits that description, with its market cap exceeding this mark, underscoring its size, influence, and dominance within theu00a0oil & gas midstreamu00a0industry.u00a0WMBu2019s strategic strength stems from its robust asset portfolio, featuring key pipeline systems like Transco and Northwest. Strategic acquisitions have expanded its capacity and reach, solidifying its position as a leading midstream player.
Despite its notable strength, WMB slipped 9.6% from itsu00a052-week high of $80.08, achieved on May 20. Over the past three months, WMB stocku00a0declined 4.4%, underperforming the Nasdaq Compositeu2019s ($NASX)u00a017.6% gainsu00a0during the same time frame.

Shares of WMB have climbed 20.5% on a YTD basis, outperforming NASXu2019s YTD gains of 15.4%. However, in the longer term, the stock rose 20.5% over the past 52 weeks, underperforming NASXu2019s 37.9% returns over the same time frame.
To confirm the bullish trend, WMB has been trading above its 200-day moving average over the past year, with some fluctuations. However, the stock is trading below its 50-day moving average since late May.u00a0
On May 4, WMB shares closed down marginally after reporting its Q1 results. Its adjusted EPS of $0.73 beat Wall Street expectations of $0.65. The companyu2019s revenue was $3 billion, falling short of Wall Street forecasts of $3.3 billion. WMB expects full-year adjusted EPS in the range of $2.20 to $2.38.
WMBu2019s rival,u00a0Kinder Morgan, Inc. (KMI)u00a0shares lagged behind the stock, with a 15.3% uptick on a YTD basis andu00a013.1% gains over the past 52 weeks.
Wall Street analysts are bullish on WMBu2019s prospects. The stock has a consensus u201cStrong Buyu201d rating from the 23 analysts covering it, and theu00a0mean price target of $84.14u00a0suggests a potential upside of 16.2% from current price levels.
n
n On the date of publication,nn Neha Panjwaninn did not have (either directly or indirectly) positions in any of the securities mentioned in this article. All information and data in this article is solely for informational purposes.n n For more information please view the Barchart Disclosure Policynn here.n“,”symbols”:[{“symbol”:”$NASX”,”symbolName”:”Nasdaq Composite”,”symbolType”:9,”lastPrice”:”25,709.43″,”priceChange”:”-1,121.53″,”percentChange”:”-4.18%”},{“symbol”:”KMI”,”symbolName”:”Kinder Morgan Inc”,”symbolType”:1,”lastPrice”:”31.68″,”priceChange”:”-0.02″,”percentChange”:”-0.06%”},{“symbol”:”WMB”,”symbolName”:”Williams Companies”,”symbolType”:1,”lastPrice”:”71.96″,”priceChange”:”-0.47″,”percentChange”:”-0.65%”}],”related”:[{“id”:”2343032″,”title”:”How Is American Electric Power’s Stock Performance Compared to Other Utility Stocks?”,”slug”:”how-is-american-electric-power-s-stock-performance-compared-to-other-utility-stocks”,”feedName”:”Barchart”,”published”:”Sat Jun 6, 3:48PM CDT”,”categories”:[“STK.EQY”]},{“id”:”2337079″,”title”:”AutoZone Stock: Is AZO Underperforming the Consumer Discretionary Sector?”,”slug”:”autozone-stock-is-azo-underperforming-the-consumer-discretionary-sector”,”feedName”:”Barchart”,”published”:”Sat Jun 6, 2:25AM CDT”,”categories”:[“STK.EQY”]},{“id”:”2336395″,”title”:”Is Public Storage Stock Underperforming the Dow?”,”slug”:”is-public-storage-stock-underperforming-the-dow”,”feedName”:”Barchart”,”published”:”Sat Jun 6, 1:03AM CDT”,”categories”:[“STK.EQY”]},{“id”:”2336071″,”title”:”Is GE Vernova Stock Outperforming the Nasdaq?”,”slug”:”is-ge-vernova-stock-outperforming-the-nasdaq”,”feedName”:”Barchart”,”published”:”Sat Jun 6, 12:25AM CDT”,”categories”:[“STK.EQY”]},{“id”:”2330007″,”title”:”Is Newmont Stock Outperforming the S&P 500?”,”slug”:”is-newmont-stock-outperforming-the-sp-500″,”feedName”:”Barchart”,”published”:”Fri Jun 5, 12:59PM CDT”,”categories”:[“STK.EQY”]},{“id”:”2328015″,”title”:”How Is Ford Motor’s Stock Performance Compared to Other Consumer Cyclical stocks?”,”slug”:”how-is-ford-motor-s-stock-performance-compared-to-other-consumer-cyclical-stocks”,”feedName”:”Barchart”,”published”:”Fri Jun 5, 11:01AM CDT”,”categories”:[“STK.EQY”]},{“id”:”2327411″,”title”:”Johnson Controls Stock: Is JCI Outperforming the Industrial Sector?”,”slug”:”johnson-controls-stock-is-jci-outperforming-the-industrial-sector”,”feedName”:”Barchart”,”published”:”Fri Jun 5, 10:28AM CDT”,”categories”:[“STK.EQY”]},{“id”:”2326427″,”title”:”How Is Microchip Technology’s Stock Performance Compared to Other Semiconductor Stocks?”,”slug”:”how-is-microchip-technology-s-stock-performance-compared-to-other-semiconductor-stocks”,”feedName”:”Barchart”,”published”:”Fri Jun 5, 9:31AM CDT”,”categories”:[“STK.EQY”]},{“id”:”2325901″,”title”:”Is D.R. Horton Stock Underperforming the Dow?”,”slug”:”is-d-r-horton-stock-underperforming-the-dow”,”feedName”:”Barchart”,”published”:”Fri Jun 5, 8:57AM CDT”,”categories”:[“STK.EQY”]}],”sourceId”:”10864464″,”media”:”text”,”thumbnail”:{“url”:”https://media.barchart.com/contributors-admin/common-images/images/Stocks%2C%20Markets%2C%20%26%20Global%20Economy/Charts%2C%20tickers%2C%20traders/A%20colorful%20concept%20image%20of%20a%20scoring%20system_%20Image%20by%20Who%20is%20Danny%20via%20Shutterstock_.jpg”,”width”:1600,”height”:1067,”caption”:”A colorful concept image of a scoring system_ Image by Who is Danny via Shutterstock_”},”summary”:”Williams Companies has underperformed the Nasdaq over the past year, but analysts are highly optimistic about the stocku2019s prospects.”,”canonicalUrl”:”https://www.barchart.com/story/news/2325535/is-williams-companies-stock-underperforming-the-nasdaq”,”slug”:”is-williams-companies-stock-underperforming-the-nasdaq”,”sourceFeed”:”CONT2″,”categories”:[“FUT.ENG”,”STK.EQY”,”STK.IND.ENG”],”meta”:”N/A”,”authorBadge”:null,”raw”:{“id”:”2325535″,”title”:”Is Williams Companies Stock Underperforming the Nasdaq?”,”author”:”Neha Panjwani”,”authorUrl”:”https://www.barchart.com/news/authors/420/neha-panjwani”,”authorImage”:”https://media.barchart.com/news/authors/420/avatar-8hJBHMX599s4Mavv.png”,”authorType”:”author”,”feed”:”SANDP”,”originalFeed”:null,”feedName”:”Barchart”,”feedUrl”:”https://www.barchart.com”,”published”:1780666406,”publishedTime”:”2026-06-05 13:33:26″,”updated”:”2026-06-05 13:33:26 +0000″,”image”:{“url”:”https://media.barchart.com/contributors-admin/common-images/images/Stocks%2C%20Markets%2C%20%26%20Global%20Economy/Charts%2C%20tickers%2C%20traders/A%20colorful%20concept%20image%20of%20a%20scoring%20system_%20Image%20by%20Who%20is%20Danny%20via%20Shutterstock_.jpg”,”width”:1600,”height”:1067,”caption”:”A colorful concept image of a scoring system_ Image by Who is Danny via Shutterstock_”},”content”:”
The Williams Companies, Inc. (WMB), headquartered in Tulsa, Oklahoma, operates as an energy infrastructure company focused on connecting North America’s hydrocarbon resource plays to growing markets for natural gas, natural gas liquids (NGLs), and olefins.u00a0With a market cap ofu00a0$87.5 billion,u00a0the companyu00a0owns and operates midstream gathering and processing assets, and interstate natural gas pipelines.
Companies worth $10 billion or more are generally described as u201clarge-cap stocks,u201d and WMB perfectly fits that description, with its market cap exceeding this mark, underscoring its size, influence, and dominance within theu00a0oil & gas midstreamu00a0industry.u00a0WMBu2019s strategic strength stems from its robust asset portfolio, featuring key pipeline systems like Transco and Northwest. Strategic acquisitions have expanded its capacity and reach, solidifying its position as a leading midstream player.
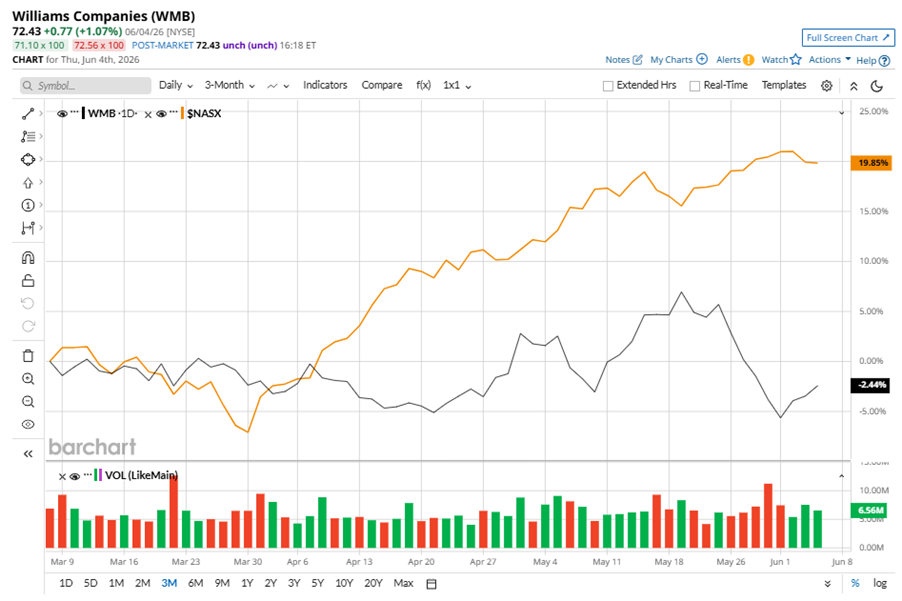
Despite its notable strength, WMB slipped 9.6% from itsu00a052-week high of $80.08, achieved on May 20. Over the past three months, WMB stocku00a0declined 4.4%, underperforming the Nasdaq Compositeu2019s ($NASX)u00a017.6% gainsu00a0during the same time frame.
Shares of WMB have climbed 20.5% on a YTD basis, outperforming NASXu2019s YTD gains of 15.4%. However, in the longer term, the stock rose 20.5% over the past 52 weeks, underperforming NASXu2019s 37.9% returns over the same time frame.
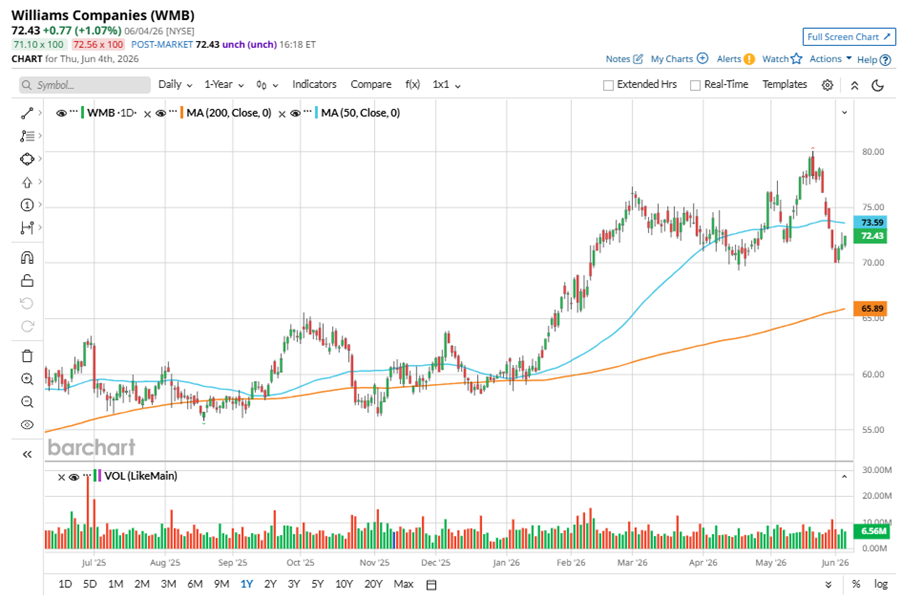
To confirm the bullish trend, WMB has been trading above its 200-day moving average over the past year, with some fluctuations. However, the stock is trading below its 50-day moving average since late May.u00a0
On May 4, WMB shares closed down marginally after reporting its Q1 results. Its adjusted EPS of $0.73 beat Wall Street expectations of $0.65. The companyu2019s revenue was $3 billion, falling short of Wall Street forecasts of $3.3 billion. WMB expects full-year adjusted EPS in the range of $2.20 to $2.38.
WMBu2019s rival,u00a0Kinder Morgan, Inc. (KMI)u00a0shares lagged behind the stock, with a 15.3% uptick on a YTD basis andu00a013.1% gains over the past 52 weeks.
Wall Street analysts are bullish on WMBu2019s prospects. The stock has a consensus u201cStrong Buyu201d rating from the 23 analysts covering it, and theu00a0mean price target of $84.14u00a0suggests a potential upside of 16.2% from current price levels.
n
n On the date of publication,nn Neha Panjwaninn did not have (either directly or indirectly) positions in any of the securities mentioned in this article. All information and data in this article is solely for informational purposes.n n For more information please view the Barchart Disclosure Policynn here.n“,”symbols”:[“$NASX”,”KMI”,”WMB”],”related”:[{“id”:”2343032″,”title”:”How Is American Electric Power’s Stock Performance Compared to Other Utility Stocks?”,”slug”:”how-is-american-electric-power-s-stock-performance-compared-to-other-utility-stocks”,”feedName”:”Barchart”,”published”:”Sat Jun 6, 3:48PM CDT”,”categories”:[“STK.EQY”]},{“id”:”2337079″,”title”:”AutoZone Stock: Is AZO Underperforming the Consumer Discretionary Sector?”,”slug”:”autozone-stock-is-azo-underperforming-the-consumer-discretionary-sector”,”feedName”:”Barchart”,”published”:”Sat Jun 6, 2:25AM CDT”,”categories”:[“STK.EQY”]},{“id”:”2336395″,”title”:”Is Public Storage Stock Underperforming the Dow?”,”slug”:”is-public-storage-stock-underperforming-the-dow”,”feedName”:”Barchart”,”published”:”Sat Jun 6, 1:03AM CDT”,”categories”:[“STK.EQY”]},{“id”:”2336071″,”title”:”Is GE Vernova Stock Outperforming the Nasdaq?”,”slug”:”is-ge-vernova-stock-outperforming-the-nasdaq”,”feedName”:”Barchart”,”published”:”Sat Jun 6, 12:25AM CDT”,”categories”:[“STK.EQY”]},{“id”:”2330007″,”title”:”Is Newmont Stock Outperforming the S&P 500?”,”slug”:”is-newmont-stock-outperforming-the-sp-500″,”feedName”:”Barchart”,”published”:”Fri Jun 5, 12:59PM CDT”,”categories”:[“STK.EQY”]},{“id”:”2328015″,”title”:”How Is Ford Motor’s Stock Performance Compared to Other Consumer Cyclical stocks?”,”slug”:”how-is-ford-motor-s-stock-performance-compared-to-other-consumer-cyclical-stocks”,”feedName”:”Barchart”,”published”:”Fri Jun 5, 11:01AM CDT”,”categories”:[“STK.EQY”]},{“id”:”2327411″,”title”:”Johnson Controls Stock: Is JCI Outperforming the Industrial Sector?”,”slug”:”johnson-controls-stock-is-jci-outperforming-the-industrial-sector”,”feedName”:”Barchart”,”published”:”Fri Jun 5, 10:28AM CDT”,”categories”:[“STK.EQY”]},{“id”:”2326427″,”title”:”How Is Microchip Technology’s Stock Performance Compared to Other Semiconductor Stocks?”,”slug”:”how-is-microchip-technology-s-stock-performance-compared-to-other-semiconductor-stocks”,”feedName”:”Barchart”,”published”:”Fri Jun 5, 9:31AM CDT”,”categories”:[“STK.EQY”]},{“id”:”2325901″,”title”:”Is D.R. Horton Stock Underperforming the Dow?”,”slug”:”is-d-r-horton-stock-underperforming-the-dow”,”feedName”:”Barchart”,”published”:”Fri Jun 5, 8:57AM CDT”,”categories”:[“STK.EQY”]}],”sourceId”:”10864464″,”media”:”text”,”thumbnail”:{“url”:”https://media.barchart.com/contributors-admin/common-images/images/Stocks%2C%20Markets%2C%20%26%20Global%20Economy/Charts%2C%20tickers%2C%20traders/A%20colorful%20concept%20image%20of%20a%20scoring%20system_%20Image%20by%20Who%20is%20Danny%20via%20Shutterstock_.jpg”,”width”:1600,”height”:1067,”caption”:”A colorful concept image of a scoring system_ Image by Who is Danny via Shutterstock_”},”summary”:”Williams Companies has underperformed the Nasdaq over the past year, but analysts are highly optimistic about the stocku2019s prospects.”,”canonicalUrl”:”https://www.barchart.com/story/news/2325535/is-williams-companies-stock-underperforming-the-nasdaq”,”slug”:”is-williams-companies-stock-underperforming-the-nasdaq”,”sourceFeed”:”CONT2″,”categories”:[“FUT.ENG”,”STK.EQY”,”STK.IND.ENG”],”meta”:null,”authorBadge”:null},”barchartAuthor”:{“id”:0,”following”:false},”contributorsServiceCategories”:[“Energy”,”Equities/Stocks”],”isBarchartAuthor”:true,”isContributorOrSyndicated”:false,”isPressRelease”:false,”isSponsoredContent”:false,”shouldLoadMoreNews”:true,”displayCaption”:true,”isFuturesArticle”:true,”shouldTruncateContent”:false,”shareLink”:”https://www.barchart.com/share/news/2325535/is-williams-companies-stock-underperforming-the-nasdaq”}” data-ng-controller=”NewsItem.newsItemCtrl as vm” data-ng-init=”shareLink=’https://www.barchart.com/share/news/2325535/is-williams-companies-stock-underperforming-the-nasdaq'”>
Neha Panjwani – Barchart – Columnist
All information and data in this article is solely for informational purposes. For more information please view the Barchart Disclosure Policy here
![]()
![]()

A colorful concept image of a scoring system_ Image by Who is Danny via Shutterstock_
The Williams Companies, Inc. (WMB), headquartered in Tulsa, Oklahoma, operates as an energy infrastructure company focused on connecting North America’s hydrocarbon resource plays to growing markets for natural gas, natural gas liquids (NGLs), and olefins. With a market cap of $87.5 billion, the company owns and operates midstream gathering and processing assets, and interstate natural gas pipelines.
Companies worth $10 billion or more are generally described as “large-cap stocks,” and WMB perfectly fits that description, with its market cap exceeding this mark, underscoring its size, influence, and dominance within the oil & gas midstream industry. WMB’s strategic strength stems from its robust asset portfolio, featuring key pipeline systems like Transco and Northwest. Strategic acquisitions have expanded its capacity and reach, solidifying its position as a leading midstream player.
Despite its notable strength, WMB slipped 9.6% from its 52-week high of $80.08, achieved on May 20. Over the past three months, WMB stock declined 4.4%, underperforming the Nasdaq Composite’s ($NASX) 17.6% gains during the same time frame.
Shares of WMB have climbed 20.5% on a YTD basis, outperforming NASX’s YTD gains of 15.4%. However, in the longer term, the stock rose 20.5% over the past 52 weeks, underperforming NASX’s 37.9% returns over the same time frame.
To confirm the bullish trend, WMB has been trading above its 200-day moving average over the past year, with some fluctuations. However, the stock is trading below its 50-day moving average since late May.

On May 4, WMB shares closed down marginally after reporting its Q1 results. Its adjusted EPS of $0.73 beat Wall Street expectations of $0.65. The company’s revenue was $3 billion, falling short of Wall Street forecasts of $3.3 billion. WMB expects full-year adjusted EPS in the range of $2.20 to $2.38.
WMB’s rival, Kinder Morgan, Inc. (KMI) shares lagged behind the stock, with a 15.3% uptick on a YTD basis and 13.1% gains over the past 52 weeks.
Wall Street analysts are bullish on WMB’s prospects. The stock has a consensus “Strong Buy” rating from the 23 analysts covering it, and the mean price target of $84.14 suggests a potential upside of 16.2% from current price levels.
On the date of publication, Neha Panjwani did not have (either directly or indirectly) positions in any of the securities mentioned in this article. All information and data in this article is solely for informational purposes. For more information please view the Barchart Disclosure Policy here.