Molson Coors Beverage (NYSE:TAP) has had a rough three months with its share price down 7.2%. But if you pay close attention, you might find that its key financial indicators look quite decent, which could mean that the stock could potentially rise in the long-term given how markets usually reward more resilient long-term fundamentals. In this article, we decided to focus on Molson Coors Beverage’s ROE.
ROE or return on equity is a useful tool to assess how effectively a company can generate returns on the investment it received from its shareholders. In other words, it is a profitability ratio which measures the rate of return on the capital provided by the company’s shareholders.
Check out our latest analysis for Molson Coors Beverage
How To Calculate Return On Equity?
The formula for return on equity is:
Return on Equity = Net Profit (from continuing operations) ÷ Shareholders’ Equity
So, based on the above formula, the ROE for Molson Coors Beverage is:
8.2% = US$1.1b ÷ US$13b (Based on the trailing twelve months to March 2024).
The ‘return’ is the profit over the last twelve months. One way to conceptualize this is that for each $1 of shareholders’ capital it has, the company made $0.08 in profit.
Why Is ROE Important For Earnings Growth?
So far, we’ve learned that ROE is a measure of a company’s profitability. Depending on how much of these profits the company reinvests or “retains”, and how effectively it does so, we are then able to assess a company’s earnings growth potential. Generally speaking, other things being equal, firms with a high return on equity and profit retention, have a higher growth rate than firms that don’t share these attributes.
Molson Coors Beverage’s Earnings Growth And 8.2% ROE
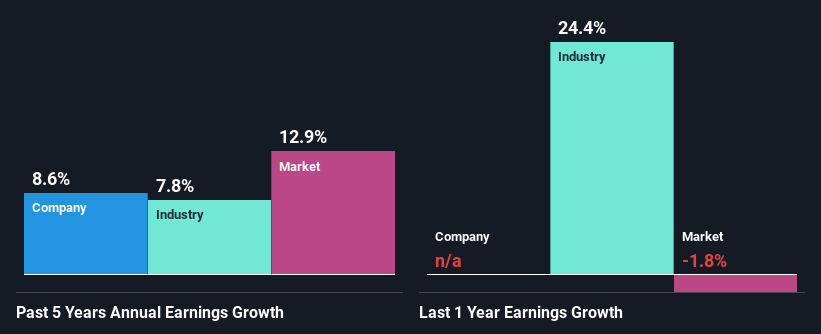
When you first look at it, Molson Coors Beverage’s ROE doesn’t look that attractive. Next, when compared to the average industry ROE of 21%, the company’s ROE leaves us feeling even less enthusiastic. However, the moderate 8.6% net income growth seen by Molson Coors Beverage over the past five years is definitely a positive. We reckon that there could be other factors at play here. Such as – high earnings retention or an efficient management in place.
We then performed a comparison between Molson Coors Beverage’s net income growth with the industry, which revealed that the company’s growth is similar to the average industry growth of 7.8% in the same 5-year period.
Earnings growth is an important metric to consider when valuing a stock. What investors need to determine next is if the expected earnings growth, or the lack of it, is already built into the share price. By doing so, they will have an idea if the stock is headed into clear blue waters or if swampy waters await. If you’re wondering about Molson Coors Beverage’s’s valuation, check out this gauge of its price-to-earnings ratio, as compared to its industry.
Is Molson Coors Beverage Using Its Retained Earnings Effectively?
Molson Coors Beverage has a low three-year median payout ratio of 21%, meaning that the company retains the remaining 79% of its profits. This suggests that the management is reinvesting most of the profits to grow the business.
Besides, Molson Coors Beverage has been paying dividends for at least ten years or more. This shows that the company is committed to sharing profits with its shareholders. Looking at the current analyst consensus data, we can see that the company’s future payout ratio is expected to rise to 33% over the next three years. Despite the higher expected payout ratio, the company’s ROE is not expected to change by much.
Conclusion
On the whole, we do feel that Molson Coors Beverage has some positive attributes. Despite its low rate of return, the fact that the company reinvests a very high portion of its profits into its business, no doubt contributed to its high earnings growth. With that said, on studying the latest analyst forecasts, we found that while the company has seen growth in its past earnings, analysts expect its future earnings to shrink. To know more about the latest analysts predictions for the company, check out this visualization of analyst forecasts for the company.
New: Manage All Your Stock Portfolios in One Place
We’ve created the ultimate portfolio companion for stock investors, and it’s free.
• Connect an unlimited number of Portfolios and see your total in one currency
• Be alerted to new Warning Signs or Risks via email or mobile
• Track the Fair Value of your stocks
Have feedback on this article? Concerned about the content? Get in touch with us directly. Alternatively, email editorial-team (at) simplywallst.com.
This article by Simply Wall St is general in nature. We provide commentary based on historical data and analyst forecasts only using an unbiased methodology and our articles are not intended to be financial advice. It does not constitute a recommendation to buy or sell any stock, and does not take account of your objectives, or your financial situation. We aim to bring you long-term focused analysis driven by fundamental data. Note that our analysis may not factor in the latest price-sensitive company announcements or qualitative material. Simply Wall St has no position in any stocks mentioned.
Have feedback on this article? Concerned about the content? Get in touch with us directly. Alternatively, email editorial-team@simplywallst.com