
Things have been going pretty well on the stock market as the bull market approaches four years this October. That’s why a lot of people are rightly nervous.
All good things come to an end, especially when a valuation gauge like the Shiller P/E ratio is at its highest level since the dot-com boom, which soon thereafter went bust.
That’s not to say a bear market is right around the corner or that a market collapse is imminent. All markets are different, and there are some key differences between this one and the nearly two-year bear market that followed the dot-com boom.
However, it is likely that markets will be volatile and, like Marvel villain Thanos, bear markets are inevitable. There have been 10 of them in the last 60 years.
What’s also undeniable is that bear markets don’t last forever. In fact, historically, they are much shorter than bull markets. History also shows that over the long term, riding out the inevitable market dips leads to solid gains.

Image source: Getty Images.
Bear markets are shorter than bull markets
According to an analysis by Winthrop Wealth, 93% of rolling 10-year periods from 1928 through today have had positive returns. Only 7% have had negative returns, with all of those negative rolling periods coming in either the 1930s or the 2000s.
One of those periods was the “lost decade” of the 2000s, which featured the dot-com bust and the Great Recession. That decade, from Dec. 31, 1999 to Dec. 31, 2009, resulted in a total return of -9.1%, or -0.9% on an annualized basis.
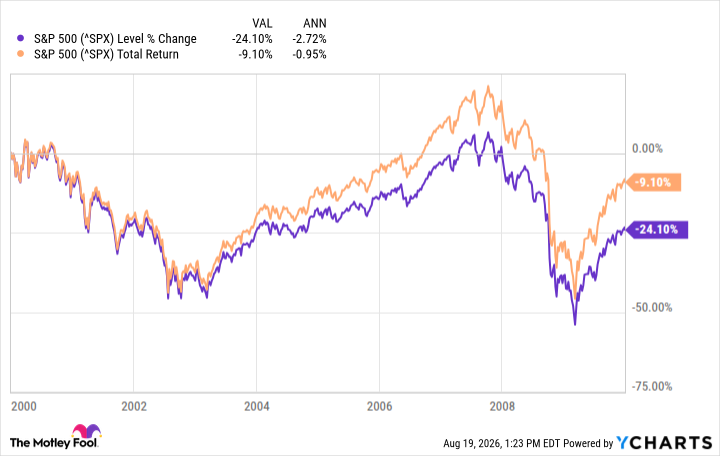
The lost decade was followed by an 11-year bull market, the second longest in history. That bull market saw the market rise 400%, or roughly 16% per year, according to an analysis by First Trust. The current almost-four-year bull market has featured a total return of approximately 110% and an average annualized return of 22%.
Furthermore, the First Trust analysis found that the average bull market has lasted 4.4 years and had an average total cumulative return of about 152.8%. The average bear market has lasted only 11 months and had a total cumulative return of -31.7%.
So the bulls clearly win out.
An 11% average return over the past 100 years
If you go back to 1926, when comprehensive data tracking of the modern stock market began, obviously, with the precursor to the S&P 500, you get a holistic view of the value of long-term investing.
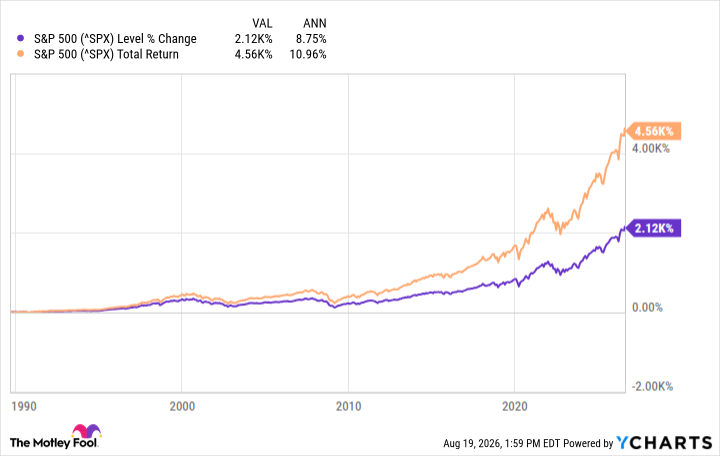
Over that 100-year stretch, the S&P 500 and its precursor have an average annualized total return, with the dividend reinvested, of 10.96% — call it 11%. That shows the value of staying invested in the market and waiting out the inevitable dips and the occasional bear market.
Even if the next rolling decade were to be a rare “lost decade” for the S&P 500, there are investments outside of large-cap U.S. stocks that would produce positive returns. For example, during the 2000s, mid-cap and small-cap stocks were each up 6%.
History also shows that rare long-term declines are followed by much higher gains over the subsequent multi-year period.