“Sell in May and stay away” used to have a case. Lately, it’s mostly had a cost.
The old warning says investors should reduce exposure after April and come back later in the year, usually around October or November.
But S&P 500 (^GSPC) history shows the seasonal map has changed a lot depending on the market era — and the modern version looks much less friendly to the slogan.
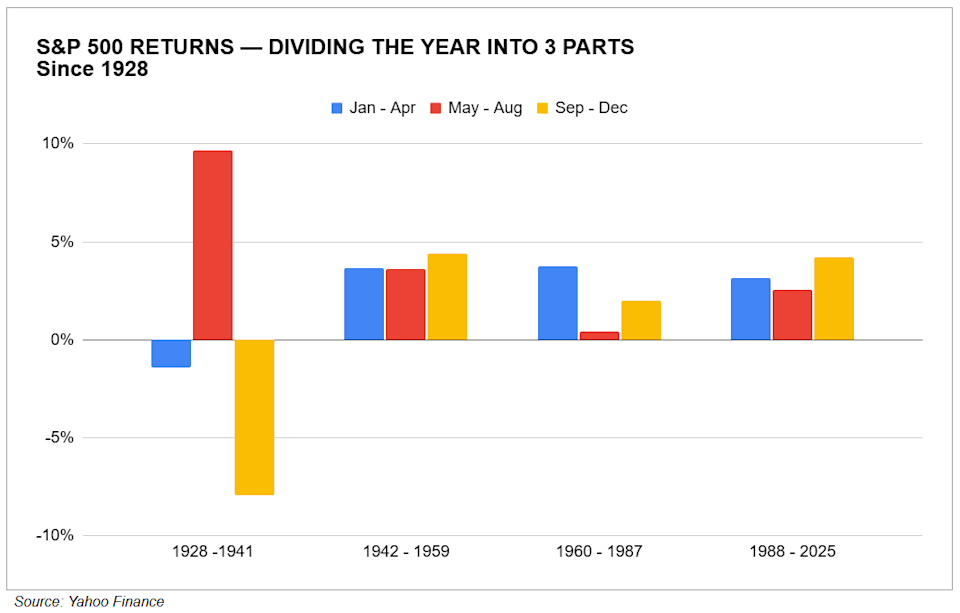
From 1928 to 1941 — the eve of the Great Depression through the early part of World War II — the stretch from May through August was actually the strongest part of the year, according to Yahoo Finance data.
From 1942 to 1959, all three chunks of the calendar — January through April, May through August, and September through December — were positive and fairly balanced.
The slogan’s best evidence came later.
From 1960 through 1987 — a period that included the inflation shocks of the 1970s, Volcker-era rate hikes, and the 1987 crash — the S&P 500’s May through August return was barely positive, making the middle of the year look like dead money compared with the rest of the calendar.
Since 1988, the market has changed again.
The rise of 401(k)s, index funds, ETFs, and automatic retirement account investing helped reshape how money moves into stocks. And in this modern stretch, “sell in May” has looked much less compelling, as all three periods have averaged positive returns.
The recent track record is even harder on the slogan. Ryan Detrick of Carson Group noted that May has been positive 12 of the past 13 years. And in years when the S&P 500 was up more than 5% through April — as it was this year — the rest of the year finished higher 23 of the past 25 times.
The full calendar seasonality map tells a similar story.

From 1988 through 2025, May averaged a gain of about 1.2%, making it stronger than half of all the months in the year. In fact, August and September were the only months with negative average returns in that period.
For investors still tempted to skip the summer months for the beach, “sell in May” may be the wrong lesson. The better takeaway is to hedge in May before going away.
Jared Blikre is the global markets and data editor for Yahoo Finance. Follow him on X at @SPYJared or email him at jaredblikre@yahooinc.com.
Click here for in-depth analysis of the latest stock market news and events moving stock prices
Read the latest financial and business news from Yahoo Finance