Buying at a record high might sound reckless, but nearly a century of market history says that fear is often overstated.
The S&P 500 (^GSPC) just posted its 10th record close of the year. That gives investors a familiar but difficult decision to make: buy a market that looks extended, or wait for a dip that may not arrive.
The numbers are surprisingly ordinary.
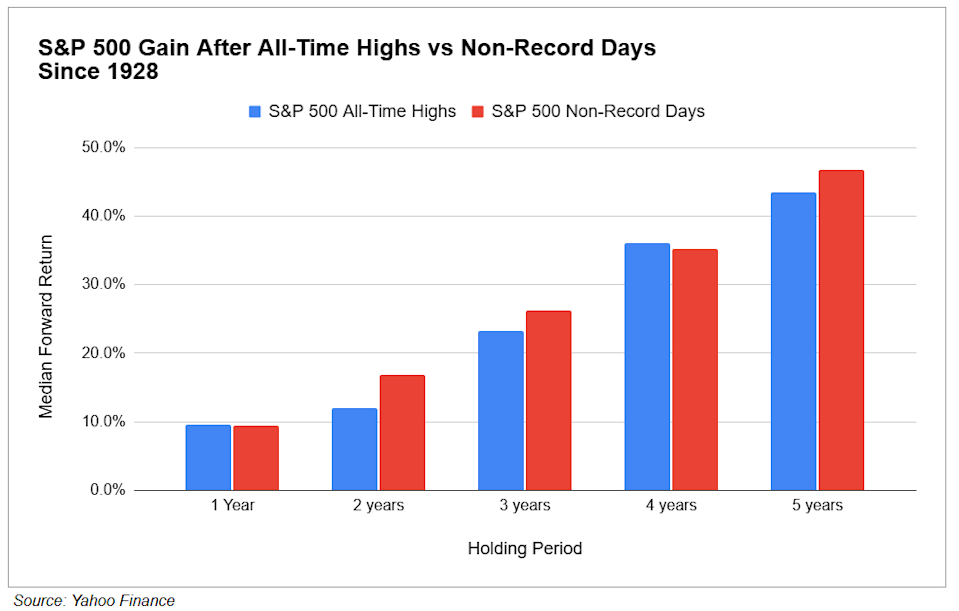
Since 1928, the S&P 500’s median one-year gain after closing at an all-time high was 9.6%, almost identical to the 9.5% median gain after non-record closes. The gap was wider over longer periods, but not in a way that turns record highs into a warning sign.
After five years, the median S&P 500 gain was about 44% following record highs, compared with 47% after non-record closes. That’s not an argument to chase every high, but it does challenge the idea that buying at highs is dangerous even over longer periods.
The win-rate data — how often the market was higher — tells a similar story. The S&P 500 was higher one year later 70% of the time in both cases, and the longer-term gaps were not large enough to change the takeaway.

All-time highs can feel like rare, fragile moments. But in reality, they tend to cluster when the market is already trending higher.
That’s one reason records can be misleading as a fear signal. A new high does not necessarily mean investors are buying the top. Often, it means they are buying into a market where momentum has already been strong enough to keep making new highs.
Since 1928, the S&P 500 has closed at an all-time high on about 6% of trading days. But there is always a record high before a nasty bear market.
In the year after S&P 500 record highs, the market’s typical worst drop from the entry point — the drawdown — was about 6%, and the worst case was a 45% slide. The index also fell by at least 10% within a year of a new high about one-third of the time.
That’s the caveat: All-time highs are not automatically dangerous, but they are not risk-free either. A record high is a reason to check the setup, not a reason by itself to step aside.
Jared Blikre is the global markets and data editor for Yahoo Finance. Follow him on X at @SPYJared or email him at jaredblikre@yahooinc.com.
Click here for in-depth analysis of the latest stock market news and events moving stock prices
Read the latest financial and business news from Yahoo Finance