Since the beginning of the year, Taiwan’s stock market, the Taiwan Stock Exchange Corporation, (TWSE, 臺灣證券交易所) has surpassed the United Kingdom, Canada, and India to become the world’s fifth largest exchange by total market capitalization (i.e., the total value of stocks on an exchange). Companies in Taiwan, South Korea, and the United States at the center of (or tangent to) the boom in global demand for artificial intelligence (AI) are driving investors’ interests and pushing up stock values.
While this is good news for companies and investors, it is important to remember that stocks are just a snapshot of economic activity, and not necessarily a good indicator of how well an economy is doing in comprehensive terms: even with a growing stock market and a growing economy, there can be pockets of instability and inequality that are underreported due to what is sometimes referred to as the “tyranny of the aggregate.”[1]
Unless the gains from the AI boom become more evenly distributed, economies like Taiwan’s still face fundamental challenges: such as uneven wage growth across different sectors and age groups, higher costs caused by trade shocks, and other affordability issues. A big-ticket number, like Taiwan’s TWD 150 trillion (roughly USD 4.5 trillion) stock market, can lead analysts to overestimate the health of the entire economy.
The Fundamentals of Taiwan’s Economy
Gross domestic product (GDP) is the most common measure used to estimate the size and health of an economy. Taiwan’s GDP in 2025 was composed of: TWD 11.5 trillion (45 percent) in private consumption, TWD 3.2 trillion (13 percent) in government spending, TWD 6.6 trillion (26 percent) in investment, and TWD 4.4 trillion in net exports (17 percent). [2] However, net exports can be misleading, as a single figure does not capture the magnitude of trade: Taiwan exported TWD 19.1 trillion, and imported TWD 14.6 trillion, worth of goods and services in 2025. Domestically, private consumption is the main driver of demand, but exports of AI-related goods are the main driver of Taiwan’s economic growth.

Figure 1: Taiwan’s gross domestic product (GDP) and stock market capitalization for each year of listed and OTC companies, 2010 – 2025. (Compiled by the author, sources: ROC Financial Supervisory Commission and ROC National Statistics Database)
In the chart above, we can see that Taiwan’s GDP, as measured in New Taiwan Dollars (TWD), was more than TWD 26 trillion in 2025. Meanwhile, the total market capitalization of the TSWE was over TWD94 trillion that same year. Both GDP and the TWSE have grown in the last 15 years and now have significant values. The annual output of Taiwan’s economy has nearly doubled since 2010, while the value of Taiwan’s stock market has nearly quadrupled. While both are important developments, understanding the difference is also important.
Stock markets are a measure of investors’ expectations rather than production, and they only represent publicly traded companies. There are over 1,000 companies listed on the TWSE, but around 800,000 registered companies across Taiwan. What is more, on the TWSE, one company – TSMC – accounts for nearly half of the total market capitalization. Thus, the size and health of a stock market can be used as one data point to estimate how well an economy is doing, but it is not a one-for-one substitute for other economic data. Anecdotally, you can buy and sell stock for a profit, adding to your wealth—but it would contribute very little to GDP.

Image: Stock data on display in Taiwan’s Stock Exchange (March 5, 2026). (Image source: Central News Agency)
Different Ways to Measure Taiwan’s Economic Performance
Taiwan’s economy is performing well but in different ways. Different measures of economic activity can give us a better understanding of exactly how Taiwan’s economy is performing.
I. GDP per capita
In 2026, Taiwan’s GDP per capita is expected to be roughly TWD 1.4 million – an increase from TWD 1.2 million in 2025. This means the economy is expected to produce more per person, but it does not mean the average citizen will be able to just go out and spend an extra TWD 200,000 this year.
II. Nominal and real wages
Wages, or earnings, are a good measure of economic activity, especially real earnings (earnings adjusted for inflation), given that these factors affect households’ and individuals’ purchasing power. Total average earnings increased by just under TWD29,000 last year.
Taiwan’s national statistics on earnings are usually divided between regular and irregular earnings (which include overtime pay and bonuses). On an annual basis, those working in the industrial sector will make about 10 percent higher total earnings than those in services. But on average, workers in the industrial sector also have lower regular earnings than those in services. Instead, industrial workers make nearly double in irregular earnings from working overtime and performance bonuses – which can be tied to higher stock values.
Whether looking at regular or irregular earnings, or the average of these two, adjusting for inflation (as measured by the consumer price index, CPI) gives different results as to what real wage growth in Taiwan looks like. In the first quarter of 2026, real regular wages rose by as much as 1.4 percent. Meanwhile, real average wages have grown a modest 2 percent compared to the same period last year. But again, the distribution of higher earnings is different between sectors while inflation affects most everyone the same.
III. Disposable income and savings per household
Other economic measures include median disposable income (income after taxes and other deductions), which was TWD 356,000 (USD 11,000) per person in 2024. There is also the consideration of average savings per household, which was TWD 277,000 (USD 9,000) that same year. Both numbers are far less than GDP per capita, or the value of the TWSE per person.
IV. National wealth
National statistics on wealth are a bit more comprehensive for measuring the total health of an economy, as these will include existing assets, such as land and financial assets like the stock market. Taiwan’s net national wealth in 2024 was TWD 259 trillion (USD 8 trillion). This comes to roughly TWD 11 million (USD 345,000) per person—which is roughly equal to South Korea’s net wealth of USD 341,000 per person. Most of Taiwan’s assets are in its land and manufacturing assets, with about 20 percent of net assets in finance.
|
Net National Wealth (NNW) in USD |
Population |
NNW per capita |
|
|
United States |
$156,715,308,000,000 |
340,095,000 |
$460,799 |
|
Taiwan |
$8,065,993,073,032 |
23,404,138 |
$344,640 |
|
South Korea |
$17,679,252,479,024 |
51,805,547 |
$341,262 |
|
Japan |
$30,037,951,014,932 |
123,802,000 |
$242,629 |
|
People’s Republic of China |
$91,300,000,000,000 |
1,408,280,000 |
$64,831 |
Figure 2: Net national wealth compared to population, for the United States, Taiwan, South Korea, Japan, and the PRC. (Chart created by author, sources include: FRED Taiwan’s Directorate-General of Budget, Accounting and Statistics, KOSTAT, Cabinet Office Japan, and AEI.)
Taiwan’s Economy in the Year Ahead
Taiwan’s annual GDP growth in the first quarter of 2026 was a whopping 13.7 percent. This is a huge number for Taiwan’s economy, and the highest since 1987. Growth is being driven by trade and the global demand for AI. Since it does not appear that this demand is expected to slow anytime soon, we can expect Taiwan’s economy to continue to see large double-digit growth in the second and third quarters of 2026. Growth may slow in the last quarter of 2026, but only because Taiwan’s economy had already grown so much in the fourth quarter of 2025. It is fair to assume that the value of the TWSE could also trend upwards with sustained demand for AI and rising GDP, but this author will not speculate on stock values.
Taiwan’s economy is doing great, but there are still challenges ahead, mainly the uneven distribution of wealth from AI-driven growth. In the short term, the greatest challenge is an increase in prices, especially for those who are not benefiting directly from AI-driven growth. Energy prices are at the top of the list of rising prices to watch out for. Every June, the monthly CPI of electricity for houses increases at least 20 percent. CPI for housing electricity is already up 5 percent over this period last year. Liquefied natural gas (LNG) and coal are the two main sources for electricity production in Taiwan. Thankfully, Taiwan is still importing enough LNG to fuel its gas-fired power plants – so there is no concern about shortages. However, global demand is driving up the price of LNG, with the cost of LNG imports in April up 50 percent over March.
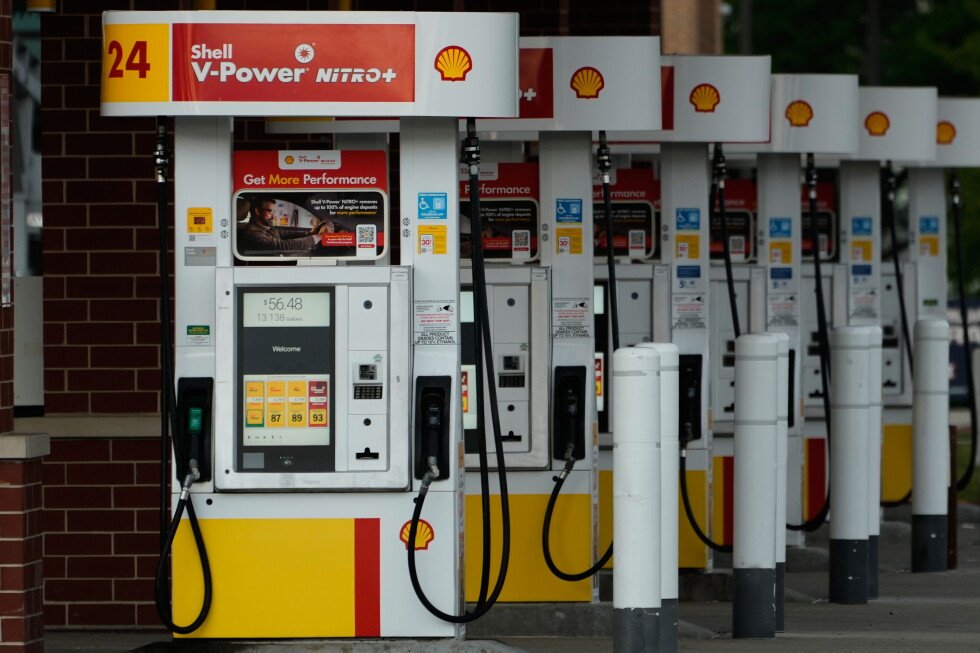
Likewise, petroleum prices are also up about 20 percent from earlier this year – driving up transportation costs and what consumers are paying at the pump. Thankfully, the government has stockpiled petroleum supplies, and can continue to subsidize to help keep costs low. The government is also continuing to promote its energy efficiency efforts to save electricity.
However, when price increases outpace wage growth, countries will face an affordability problem. Even countries with real wage growth can still face affordability challenges – especially for those that work in industries that are less profitable.
Stock values might do well for those working at companies that are listed in the TWSE or those invested in finance. But this provides a narrow view of the health of Taiwan’s economy. Even statistics on metrics like net national wealth are still an imperfect measurement. Economic statistics can be confusing, and we should not confuse the performance of Taiwan’s stock market with the overall economy.
The main point: Taiwan’s stock market has grown significantly in recent years but should not be confused with other economic data. Stocks are generally a reflection of expectations, while GDP is a measure of past production. Taiwan faces several economic challenges this year even as the economy continues to grow. Rising prices and an uneven distribution of wealth are just two of these challenges.
[1] “Tyranny of the aggregate” refers to when large accounting numbers mask the change of smaller, specific numbers. Also referred to as aggregation bias, an example could be a spike in the cost of consumer energy prices while changes to total consumer prices are only moderate.
[2] GDP is a snapshot of past economic activity as it measures the sum of all private consumption, government spending, investment, and net exports (exports minus imports) within a given period – usually within a year or a quarter of a year. But even GDP is an imperfect measure as it does not normally account for the accumulation and distribution of wealth.