
Steven Porrello, The Motley Fool
Key Points
-
Each of the three major indexes is trading at record highs.
-
The stock market’s CAPE ratio is the second-highest in history, behind only the dot-com era.
-
No one can predict stock market crashes or corrections, but investors can prepare themselves.
You’ve probably heard the saying, “Records are made to be broken.” Or maybe you’ve heard the Wall Street version, “An all-time high isn’t a ceiling.” Either could be applied to the stock market right now, which has been notching record highs at an astonishing pace.
There are, however, some concerning signs in the market today. What goes up must come down, and lately, one major signal that could point to a correction or crash in the near future is flashing. If, to continue the adages, all good things come to an end, what does that mean for investors today?
Missed Nvidia in 2009? This Rare Signal Is Flashing Again.In 2009, a “Double Down” signal flashed for a little-known chipmaker called Nvidia. For the first time in years, that same “Total Conviction” signal is flashing for a company 1/100th the size of Nvidia. Continue »
The stock market is nearing its highest valuation in history
Since late 2022, the stock market has been on a historic run.
Indeed, the three major indexes — the S&P 500(SNPINDEX: ^GSPC), the Dow Jones Industrial Average(DJINDICES: ^DJI), and the Nasdaq Composite (NASDAQINDEX: ^IXIC) — have each posted double-digit gains for three consecutive years. All three are up double digits again in 2026; if those gains hold, it would mark the first four-year streak of its kind since the dot-com era.
This remarkable bull run has pushed each index to all-time highs. The catch, however, is that it has also pushed stock market valuations toward a dangerous high.
Data by YCharts
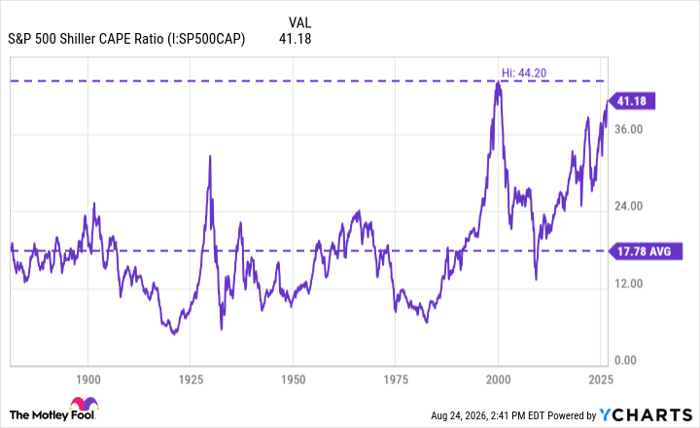
The CAPE ratio can help us gauge the market’s current valuation. It compares the S&P 500’s price with its average inflation-adjusted earnings over the last 10 years. Higher CAPE ratios mean the market is more expensive, while anything below the average (18) would mean investors are paying less than usual for the market’s earnings.
Historically, high CAPE ratios have typically preceded market corrections or crashes. For example, during the 1920s, the CAPE hit a historic high of about 32.6 before the notorious market crash that ended the Roaring Twenties. Likewise, in 2000, the CAPE hit an all-time high of 44.2 just before the dot-com bubble burst.
Today, for the first time since the 2000s, the CAPE is back in the 40-plus territory. That makes today’s market the second-most-expensive period in roughly 155 years of market history, at least by its own measure.
How to invest when market valuations are historically high
It would be a mistake to read a high CAPE as a sign to avoid the stock market. No one can predict a stock market crash, and you could miss out on some of the market’s best days if you pull out your money.
Instead, I would read a high CAPE as a strong reminder to be deliberate and careful with your investments. Today’s market is richly valued, and if a correction brings valuations back down to earth, some companies will weather the storm better than others. Look for blue chip companies with strong earnings, wide margins, and deep competitive moats. Conversely, be cautious with companies whose valuations depend on growth that hasn’t materialized.
Ultimately, no one can time the market. Rather than predicting a market crash, it’s best to stay invested and continue contributing to your investment accounts regularly. Historically, investors who stay invested over the long run have fared better than those who repeatedly jump in and out.
Should you buy stock in S&P 500 Index right now?
Before you buy stock in S&P 500 Index, consider this:
The Motley Fool Stock Advisor analyst team just identified what they believe are the 10 best stocks for investors to buy now… and S&P 500 Index wasn’t one of them. The 10 stocks that made the cut could produce monster returns in the coming years.
Consider when Netflix made this list on December 17, 2004… if you invested $1,000 at the time of our recommendation, you’d have $439,308!* Or when Nvidia made this list on April 15, 2005… if you invested $1,000 at the time of our recommendation, you’d have $1,286,826!*
Now, it’s worth noting Stock Advisor’s total average return is 964% — a market-crushing outperformance compared to 212% for the S&P 500. Don’t miss the latest top 10 list, available with Stock Advisor, and join an investing community built by individual investors for individual investors.
*Stock Advisor returns as of August 27, 2026.
Steven Porrello has no position in any of the stocks mentioned. The Motley Fool has no position in any of the stocks mentioned. The Motley Fool has a disclosure policy.