The S&P 500 (SNPINDEX: ^GSPC) has been on quite a ride recently. After gaining more than 6% in the first two weeks of August, it’s now 2% off its Aug. 13 high. The Nasdaq Composite‘s performance over the same period has been even more up-and-down (hardly a surprise for the tech-heavy index) — up nearly 10%, then down nearly 3%.
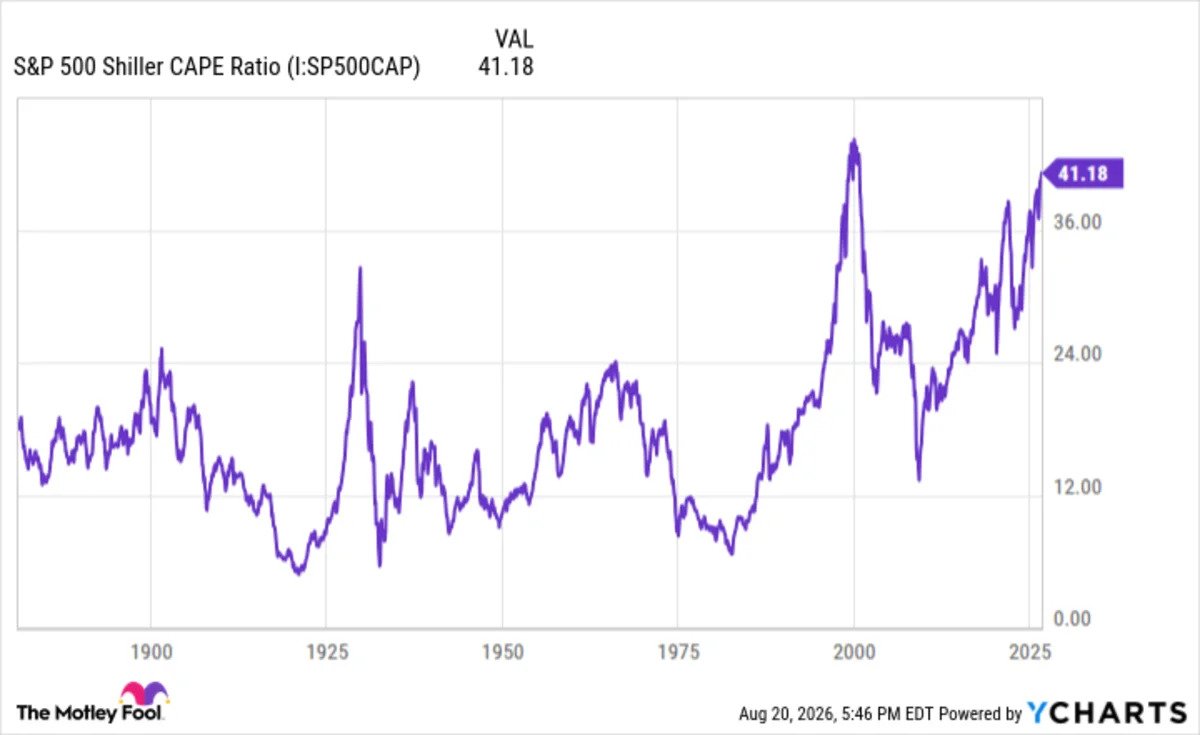
Something else happened during those weeks that’s definitely worth paying attention to: The Shiller CAPE ratio, the most widely followed measure of how expensive the stock market is, crossed above 41. In 145 years of data, it’s been above 41 exactly twice — right now, and at the peak of the dot-com bubble in late 1999.
Missed Nvidia in 2009? This Rare Signal Is Flashing Again. In 2009, a “Double Down” signal flashed for a little-known chipmaker called Nvidia. For the first time in years, that same “Total Conviction” signal is flashing for a company 1/100th the size of Nvidia. Continue »
So what should an investor do?
The CAPE ratio’s 145-year average is 17.4, and today it’s above 41
CAPE stands for cyclically adjusted price-to-earnings ratio. It takes the price of the S&P 500 and divides it by the index’s average inflation-adjusted earnings over the past 10 years. That’s helpful because a regular price-to-earnings (P/E) ratio can get thrown off by one great year or one terrible one, and the 10-year average strips a lot of that noise out.
The long-run mean is 17.4, and the all-time record is December 1999, when the CAPE reached just above 44. Months later, the dot-com bubble burst, and the S&P 500 proceeded to lose nearly half of its value. Take a look at the CAPE ratio over the last 145 years.

The Buffett indicator hit an all-time high above 240% on Aug. 18
The CAPE ratio isn’t the only market gauge at an extreme level. The Buffett indicator — the total value of the stock market divided by the gross domestic product (GDP), a measure of the size of a country’s whole economy — is now north of 240% as of Aug. 18, 2026. That’s an all-time high.
The Oracle of Omaha himself, Warren Buffett, who popularized the indicator in 2001 — in the aftermath of the dot-com crash — wrote that when the ratio approaches 200%, “you are playing with fire.” We are now well beyond that and well beyond its peak in 1999.
Buybacks, accounting changes, and foreign earnings all affect today’s readings
Now, let me address a few things straight on: There are real issues with giving too much credence to any one metric, and both of these have their flaws. Buffett himself has cautioned investors not to over-emphasize his indicator. For one, over time, markets have simply become a bigger part of our economy, and more people are invested in stocks than ever before. That will naturally shift the balance.