
25.08.2025 12:00 2 min. read Kosta Gushterov

The U.S. stock market has officially entered its most expensive phase in history, according to fresh data highlighted by Barchart.
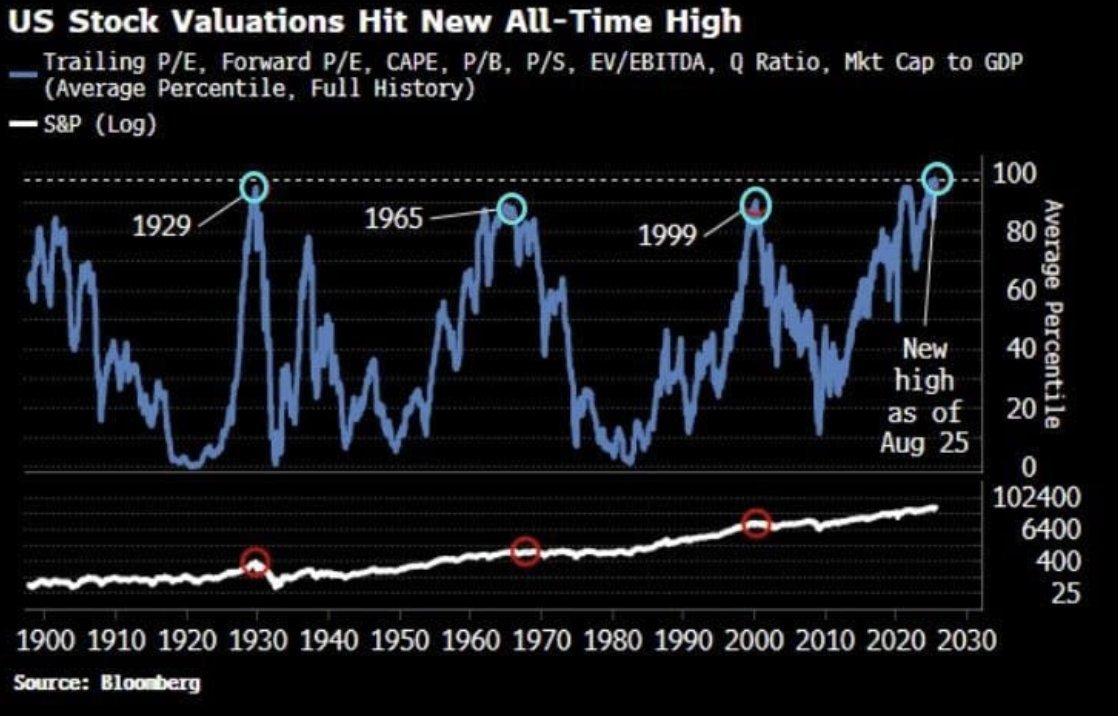
Valuation metrics, including price-to-earnings ratios and market-cap-to-GDP comparisons, have pushed past levels last seen during the 1999 Dot-Com bubble and even the 1929 run-up before the Great Depression.
A New All-Time High
As of August 25, the average percentile of major valuation indicators reached a historic peak. The chart, which tracks metrics like CAPE, P/B, EV/EBITDA, and the Q Ratio, shows today’s market stretching beyond all prior extremes in more than a century of data.
The current reading surpasses notable peaks in:
- 1929, before the Great Depression crash
- 1965, during post-war expansion
- 1999, at the height of the Dot-Com frenzy
What It Means for Investors
Such extremes are historically rare and often precede periods of heightened volatility. Analysts warn that while strong earnings and liquidity can support elevated prices in the short term, valuations this stretched may amplify downside risks if economic conditions shift.
Still, bulls argue that structural changes – including the dominance of tech megacaps, global capital inflows, and unprecedented central bank support – could justify valuations remaining higher for longer than past cycles.
Looking Ahead
With the S&P 500 continuing its upward trajectory, the debate now centers on whether this milestone marks the beginning of another prolonged bubble – or simply a new normal in equity markets dominated by technology and AI-driven growth.

Kosta has been working in the crypto industry for over 4 years. He strives to present different perspectives on a given topic and enjoys the sector for its transparency and dynamism. In his work, he focuses on balanced coverage of events and developments in the crypto space, providing information to his readers from a neutral perspective.