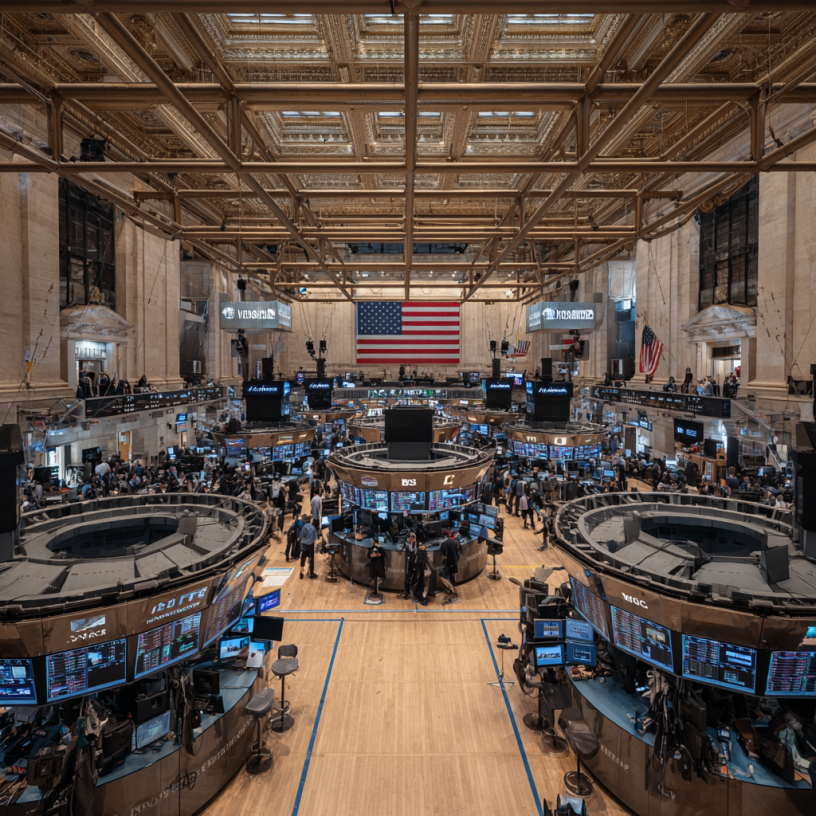
The stock market has been on a seemingly unstoppable run in 2026, as both the benchmark S&P 500 (SNPINDEX: ^GSPC) and the Nasdaq Composite (NASDAQINDEX: ^IXIC) reached new record highs this week. In the last six months alone, these indexes are up by around 19% and 26%, respectively.
Stock prices can only climb so high before they face a correction, however. The question on many investors’ minds, then, is how close we are to that point.
Missed Nvidia in 2009? This Rare Signal Is Flashing Again. In 2009, a “Double Down” signal flashed for a little-known chipmaker called Nvidia. For the first time in years, that same “Total Conviction” signal is flashing for a company 1/100th the size of Nvidia. Continue »
While no one can say how the market will perform in the coming months, Warren Buffett delivered a blunt warning to investors who may be underestimating risk right now.

Some investors may be making a costly mistake
Earlier this year, in an interview with CNBC during Berkshire Hathaway‘s annual meeting, Warren Buffett offered his thoughts on this historically expensive market.
He explained that he often compares the market to a church with a casino attached. The church represents long-term investing rooted in fundamentals, while the casino symbolizes short-term speculative buying.
“[W]e’ve never had people in a more gambling mood than now,” he warned. He added, however, that “that doesn’t mean that investing is terrible. It does mean that prices for an awful lot of things will look very silly.”
With valuations climbing, there’s a greater chance that some stocks’ prices are straying from their fundamentals. Overvalued stocks tend to correct themselves eventually, and they’ll often underperform the market over time. If you buy these stocks at the top, there’s often nowhere to go but down.
History has an important lesson for investors
No two market downturns are identical, but in some ways, the current market is showing parallels to the dot-com bubble of the early 2000s — particularly when it comes to valuations.
The S&P 500 Shiller CAPE Ratio is a metric that tracks the S&P 500’s valuation over time by measuring its 10-year inflation-adjusted earnings. A higher ratio suggests the market may be overvalued, and historically, stock prices tend to fall in the years following peaks.
In late 1999, the ratio spiked to a record high of 44 — significantly higher than its long-term average of around 17. Just a few months later, in March 2000, the dot-com bubble burst.

S&P 500 Shiller CAPE Ratio data by YCharts