The stock market made headlines recently for closing out its best quarter in years between early April and late June.
Since then, however, stocks have stumbled. The S&P 500 (^GSPC +0.05%) is down nearly 1% so far this month, as of this writing, while the tech-heavy Nasdaq Composite (^IXIC -0.64%) has dipped by close to 3.5%, its third straight week of declines.
Between surging oil prices threatening to drive up inflation and tech companies grappling with concerns around AI spending, the market has a lot on its plate. One stock market metric Warren Buffett has endorsed could be sending a warning sign to investors, and history suggests investors may want to exercise caution.

Image source: The Motley Fool.
Investors may be “playing with fire,” according to Buffett
During the lead-up to the bursting of the dot-com bubble, Buffett predicted that stocks were on the verge of a major market meltdown. The metric he used was the ratio of the total value of U.S. stocks to gross domestic product, which has since been nicknamed the “Buffett indicator.”
This metric aims to measure valuation trends in the overall market. A higher figure suggests the market may be overvalued, while a lower figure implies it’s undervalued. In a 2001 interview with Fortune magazine, Buffett explained how he interprets the indicator.
“For me, the message of that chart is this,” he said. “If the percentage relationship falls to the 70% or 80% area, buying stocks is likely to work very well for you. If the ratio approaches 200% — as it did in 1999 and a part of 2000 — you are playing with fire.”
As of this writing, the Buffett indicator sits at just over 236%, the highest point in history.
The S&P 500 is also sounding the alarm
The Buffett indicator isn’t the only metric raising red flags. The S&P 500 Shiller CAPE ratio also provides a snapshot of market valuations, but it does so by measuring the S&P 500’s 10-year inflation-adjusted earnings.
There are two points in history when this ratio spiked dramatically. This first was leading up to the Great Depression, when it surpassed 30. It surged again in the late 1990s, and it reached an all-time high of 44 before the dot-com bubble burst. It’s currently just over 41, the second highest this metric has ever been.
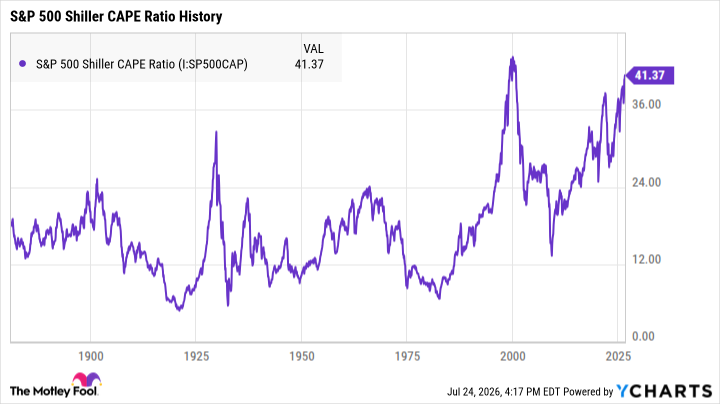
S&P 500 Shiller CAPE Ratio data by YCharts
Now, this doesn’t mean a stock market crash is imminent. Company valuations have been rising over the past two decades, and a high valuation doesn’t always mean a company is overvalued.
That said, it’s still wise for investors to be cautious when choosing investments. It’s unusual for the market to be this richly valued, and with so much of the market concentrated in tech and AI, choosing the wrong stocks could be costly if we’re in a bubble.
What history says investors should do right now
It’s only a matter of time before we face a market downturn, and while it’s impossible to say when it will begin or how severe it might be, investing in quality stocks can help protect your portfolio.
Again, not all highly valued stocks are technically overvalued. But there’s no shortage of hype in the market right now, and it can be tough to distinguish the strong stocks from the weak when many of them are surging in price.
Overvalued stocks have the most to lose when the market takes a turn, and those stocks pose the highest risk for investors. During the dot-com era, for instance, hundreds of internet companies exploded in value only to crash and burn when the bubble popped.
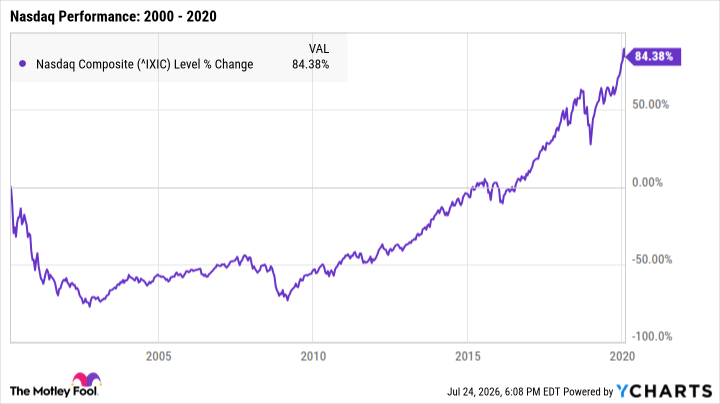
While that bear market was especially brutal for the Nasdaq — with the index losing nearly 80% of its value between 2000 and 2002 — there were still enough healthy tech stocks to lift it to new heights in the years that followed.
If history proves one thing, it’s that fundamentals matter far more than hype. Overvalued stocks with shaky foundations may struggle to survive the next downturn. Healthy stocks, however, are the most likely to recover from volatility and help investors build substantial wealth over time.