

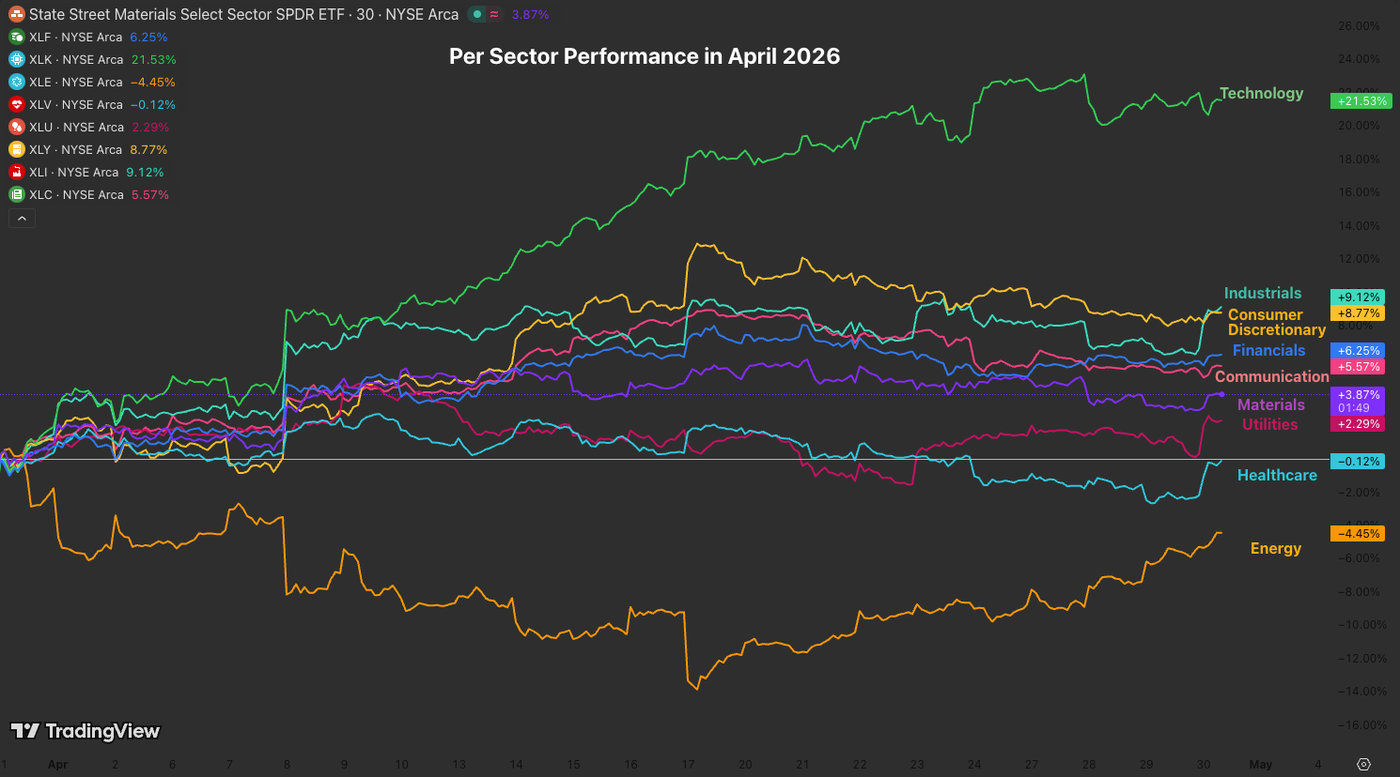
- US Stock Benchmarks are once again moving in different directions with traditional sectors picking up momentum and highly priced Tech retreating
- Record earnings in defensive blue chips bring back the hype for the Dow Jones
- Exploring Technical Levels for the Dow Jones, Nasdaq and S&P 500
US Stock Markets are on the rise again after FOMC day, powered by waves of record earnings, a lower US Dollar, and still no signs of rate hikes from Jerome Powell’s latest press conference.
The US economy has been deemed robust by the Fed, and justifiably so. Jobs numbers remain stable, the unemployment rate is still well below the long-term average despite limited labor market growth, retail sales are persistently rising, and US PMIs remain well above contraction territory. (More on this coming throughout tomorrow and next week.)
After the immense run in tech, defensive stocks are now taking the lead, propelled by Caterpillar’s gigantic 10% surge on record generator orders for AI servers.
This, combined with stellar earnings in prior weeks, is helping the Dow Jones outperform its peers.
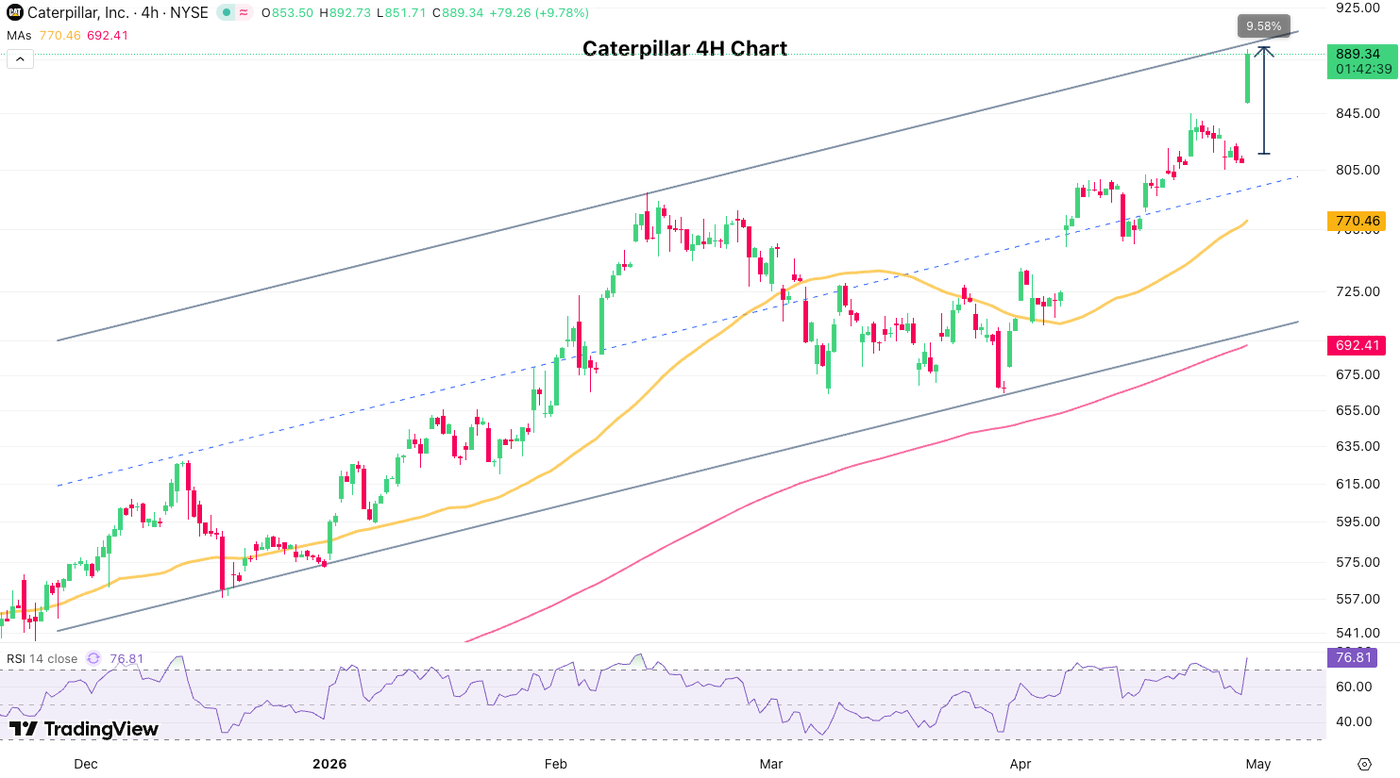
What a chart from Caterpillar! It will be interesting to see if bulls can manage a break out of the higher timeframe channel, beyond $900.
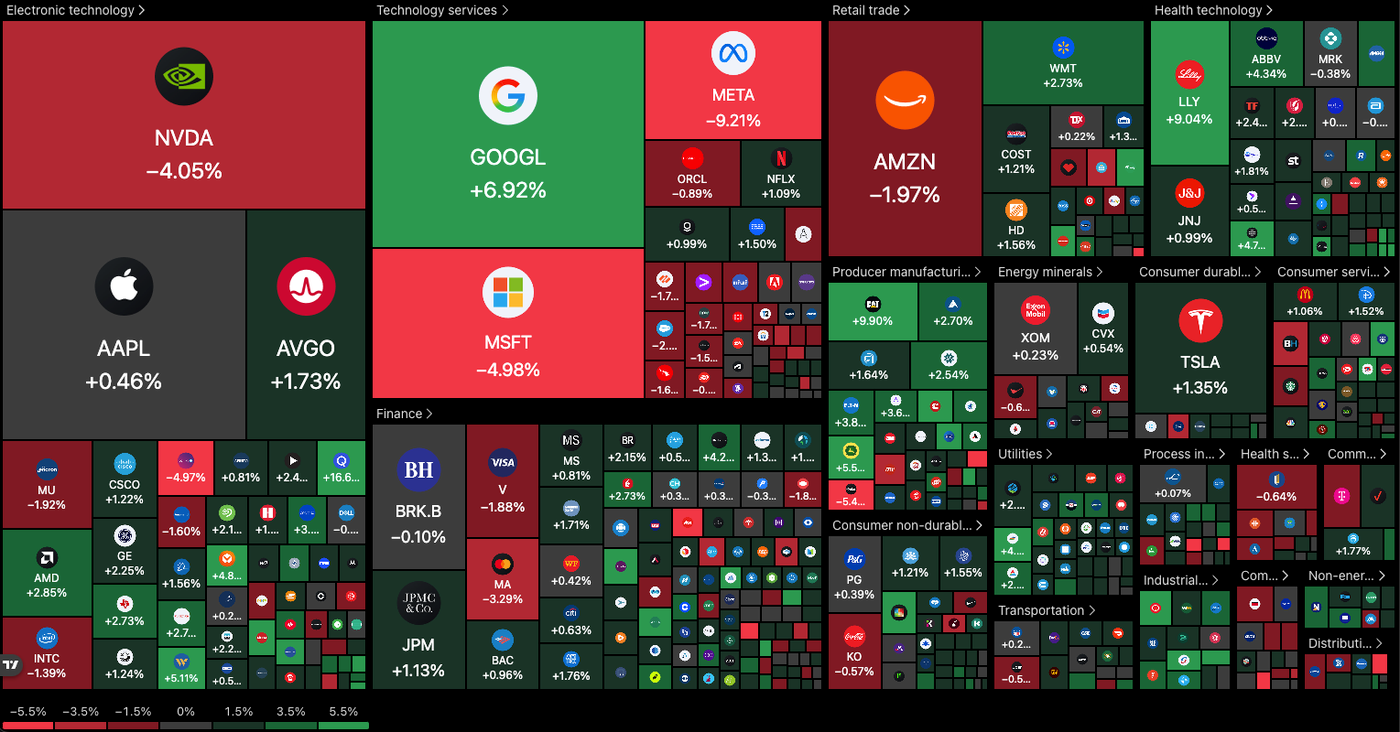
Yesterday’s mega-cap earnings underscored a massive AI-driven boom despite towering infrastructure costs.
Google, Amazon, and Microsoft posted staggering double-digit cloud revenue growth, with Microsoft’s AI business surging 123%.
While Meta beat expectations with a 33% revenue jump, its shares are getting offered heavily following a $10 billion CAPEX hike for AI data centers (something that investors are still not appreciating much).
The defensive stock trade could deliver more consistent outperformance now that most mega-cap earnings are behind us. Investors are likely to rotate quickly from sector to sector, with volatile trading and shifting fundamentals requiring constant adjustments.
As highlighted in many of our pieces in early 2026, the age of passive investing is long gone, so don’t forget to keep your eyes open for new opportunities.
Let’s dive into intraday charts and trading levels for the Dow Jones Industrial Average, Nasdaq Composite, and S&P 500.
Current Session’s Stock Heatmap
It has been a long time since defensive Stocks haven’t completely outperformed Tech, but this is trend is picking up again after the earnings.
With record numbers extending fundamentals, High MOAT value stocks continue to find attraction with investor sentiment still quite unsure.
Dow Jones 4H Chart and Trading Levels
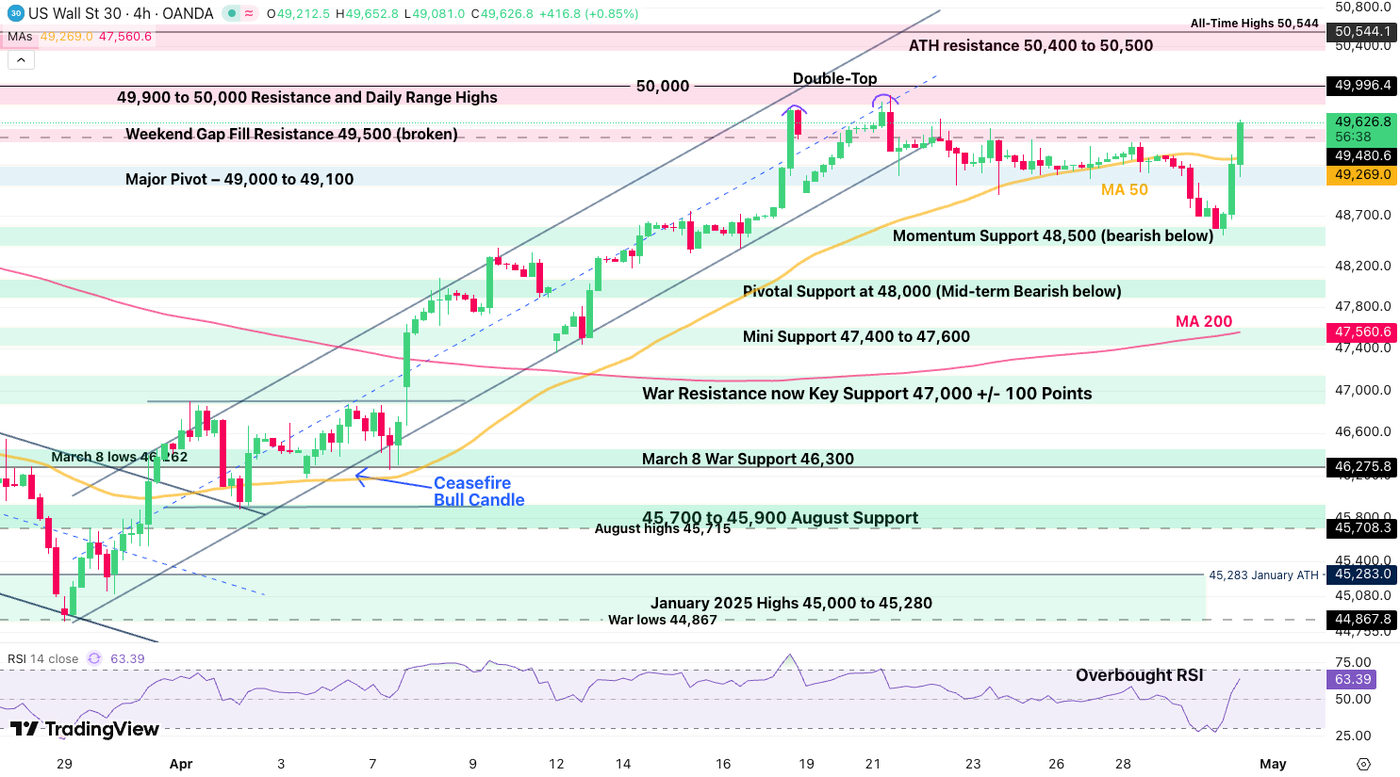
What a turn in the Dow Jones after the FOMC, subject to a +1,000 point explosion since reaching 48,500 just yesterday, propelled by defensive sectors on the rise again.
Without many elements to defend the rally, 50,000 should be getting reached soon (barring any fundamental change in US-Iran negotiations).
Watch for reactions at the psychological milestone; breaking above should go retest and even break the all-time highs.
Dow Jones technical levels for trading:
Resistance Levels
- Weekend Gap Fill Resistance 49,500 – 49,600 (broken)
- 49,900 to 50,000 Resistance and Early 2026 Highs
- ATH resistance 50,400 to 50,500
- All-Time Highs 50,544
Support Levels
- 4H 50-period MA (49,270)
- Major Pivot – 49,000 to 49,200
- Momentum Support 48,500 (short-term bearish below)
- Pivotal Support at 48,000
- Mini Support 47,400 to 47,600
Nasdaq 4H Chart and Trading Levels
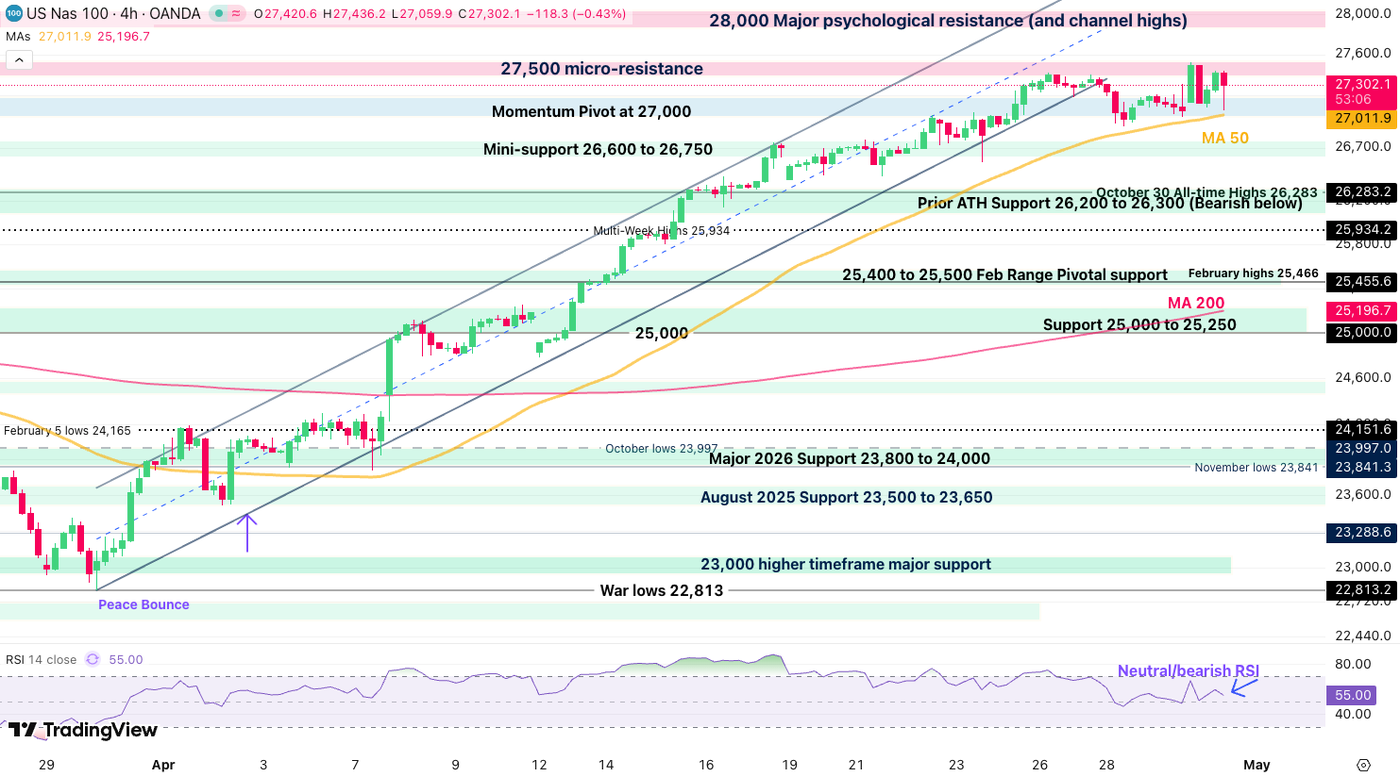
Nasdaq is losing some steam, consolidating above 27,000 but stalling its momentum quite aggressively.
Watch out for a break below the 4H 50-period MA as it should quickly lead to a retest of the prior all-time highs (~26,300).
Buying the dip here could be interesting but this would be contingent on bearish momentum not picking up too much.
Nasdaq technical levels of interest:
Resistance Levels
- Daily highs 27,424
- 27,500 micro-resistance
- 28,000 Major psychological resistance (and channel highs)
Support Levels
- Momentum Pivot at 27,000 (4H 50-period MA)
- Mini-support 26,600 to 26,750
- Prior ATH Support 26,200 to 26,300
- War Support 25,000 to 25,250
- Early 2025 ATH at 22,000 to 22,229 Support
S&P 500 4H Chart and Trading Levels
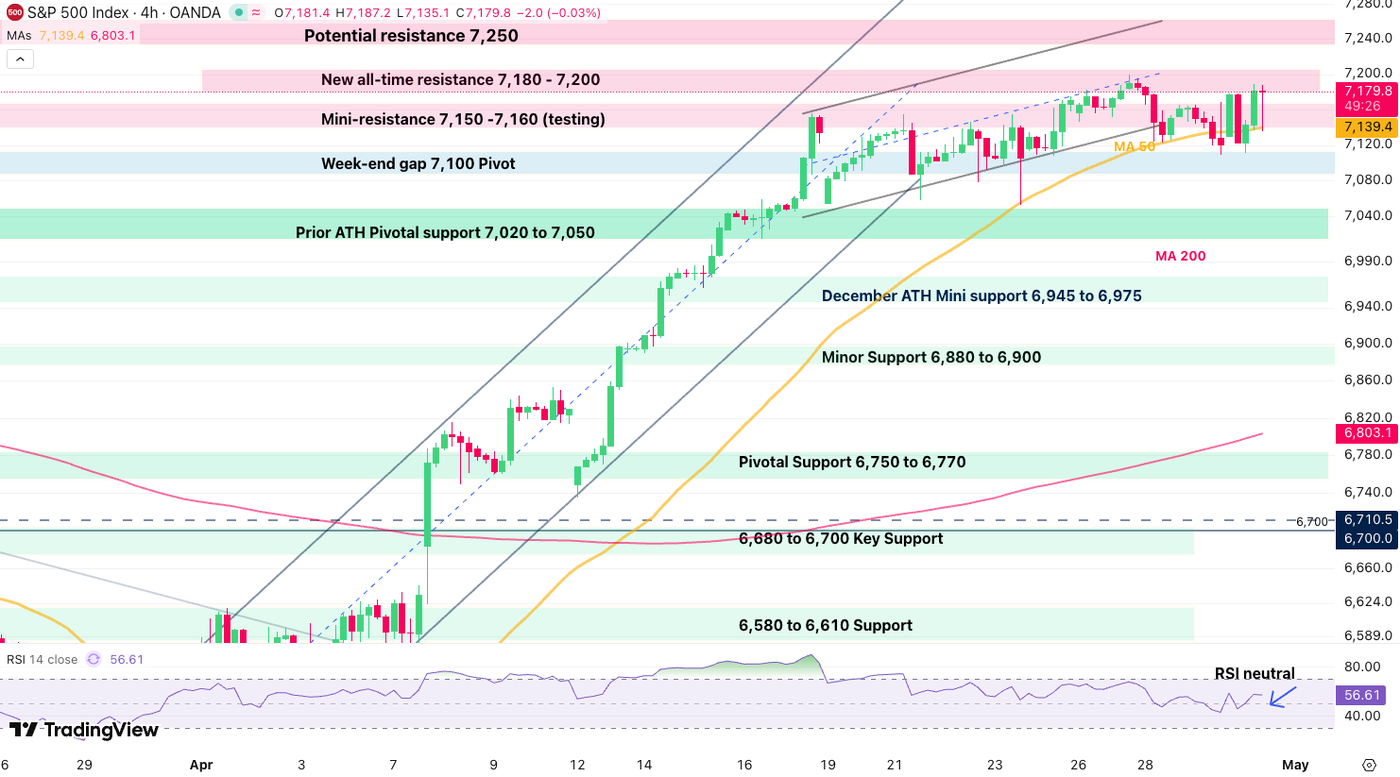
The S&P 500 is now consolidating quite strongly within its 7,100 to 7,200 range, and this looks to become a solid trend for the time being as investors now turn to targeted sector plays.
Keep an eye on breakouts above and below these key levels.
S&P 500 technical levels of interest:
Resistance Levels
- Key Range resistance 7,200
- Mini-channel highs 7,260
Support Levels
- 7,100 psychological level and 4H 50-period MA
- Prior ATH Pivot 7,000 to 7,020
- Minor Support 6,880 to 6,900
- Pivotal Support 6,750 to 6,770
- 6,300 psychological level (War lows)
Keep track of WTI Crude and the latest headlines throughout the week to stay ahead of the curve, with investors still confused about US-Iran negotiations.
Safe Trades!
Follow Elior on Twitter/X for Additional Market News, interactions and Insights @EliorManier
Opinions are the authors’; not necessarily that of OANDA Business Information & Services, Inc. or any of its affiliates, subsidiaries, officers or directors. The provided publication is for informational and educational purposes only.
If you would like to reproduce or redistribute any of the content found on MarketPulse, an award winning forex, commodities and global indices analysis and news site service produced by OANDA Business Information & Services, Inc., please refer to the MarketPulse Terms of Use.
Visit https://www.marketpulse.com/ to find out more about the beat of the global markets.
© 2026 OANDA Business Information & Services Inc.
About the Author

Elior Manier
Market Analyst
Elior brings over seven years of experience in financial markets to our analyst team. Since 2018, he has actively engaged in observing, charting, and trading, driven by his passion for mastering market dynamics. With a profound understanding of the geopolitical and macroeconomic forces that shape market movements, Elior focuses on analysing the impact of breaking news, market sentiment, and critical economic data releases on trading flows.
As a versatile analyst, he contributes powerful insights to the team, effectively integrating geopolitical and technical analysis to provide clear and comprehensive market perspectives.
Prior to joining our team, Elior honed his expertise as a Fixed Income Trader and Market Analyst at the Montreal Exchange.