| Market Closed –
Nasdaq 04:00:00 2026-10-08 pm EDT |
After hours 07:59:49 pm | |||
| 128.34 USD | +3.73% | |
129.14 | +0.62% |
For a large number of industrial companies and publicly traded businesses, today’s dominant issue is not AI but the return of inflation with a vengeance.



Inflation is penalizing cost structures that were miraculously spared for more than a decade, while also weighing on sales, particularly for companies operating in fiercely competitive markets where their pricing power proves limited.
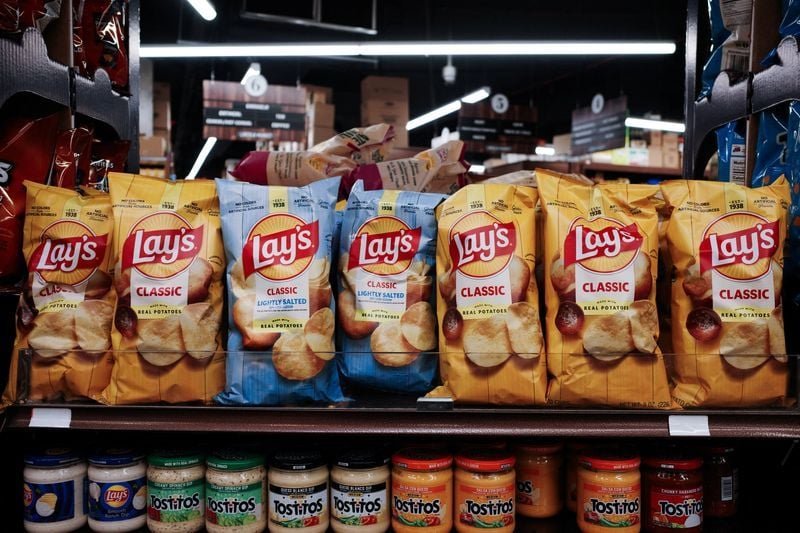
Snack and soda giant PepsiCo, which reported its Q3 results yesterday, is suffering from this environment like many others, even as it navigates it while limiting the damage. On an organic basis, however, its sales and operating profit are growing more slowly than inflation.
PepsiCo now expects adjusted earnings per share, excluding exceptional items, to increase by 2.5% to 3.5% in 2026, compared with US inflation, which is currently hovering around 3.4%. It also plans to distribute $8.9bn to shareholders, representing all of its free cash flow.
Although in the past we have not spared the group in Fundamentals to watch at PepsiCo, previously published in these same columns, it must be acknowledged that not everything is negative, and that the glass sometimes deserves to be viewed as half full rather than half empty.
PepsiCo’s sacrosanct dividend, which remains adequately covered, is indeed beginning to look increasingly attractive as the stock price continues to fall. It has quintupled over the past 20 years and, let us recall, is now in its 54th consecutive year of increases.
In this regard, the dividend yield, which is trading at an all-time high, could appeal to investors who favor such stocks, all the more so because it is paired with a stock market valuation that, measured as a multiple of earnings, has returned to its historical lows, the very levels reached during the worst moments of the subprime crisis in 2008 and the pandemic 12 years later.
Over the past decade, excluding exceptional items, PepsiCo has seen its EPS grow by an average of 5.3% p.a. Its dividend per share, meanwhile, has increased at an annualized rate of 7%. These figures should be compared with a stock yield that is currently about 50 basis points below that of 10-year US Treasury notes.

© MarketScreener.com – 2026


PepsiCo, Inc. is one of the worldwide leaders in producing non-alcoholic beverages and snacks. Net sales break down by area of activity as follows: – North America (60%): sale of beverages (50.3% of net sales; sodas, concentrated juices, water, tea and coffee-based beverages; Aquafina, Diet Mountain Dew, Diet Pepsi, Gatorade, Gatorade Zero, Mountain Dew, Pepsi, Propel brands, etc.), snacks (44.9%; chips, tortillas and pretzels; Lay’s, Doritos, Tostitos, Cheetos, Fritos, Ruffles, etc.), and cereals (4.8%; ready-to-eat cereals, rice, wheat, etc.); – Europe (15.1%): sale of snacks (Cheetos, Chipita, Doritos, Lay’s, Ruffles and Walkers brands) and beverages (7UP, Diet Pepsi, Lubimy Sad, Mirinda, Pepsi and Pepsi Max); – Latin America (12.8%): sales of snacks (Cheetos, Doritos, Emperador, Lay’s, Mabel, Marias Gamesa, Ruffles, Sabritas, Saladitas and Tostitos brands) and beverages (7UP, Gatorade, H2oh!, Manzanita Sol, Mirinda, Pepsi, Pepsi Black, San Carlos and Toddy); – Africa/Middle East/South Asia (6.8%): sale of snacks (Chipsy, Doritos, Kurkure, Lay’s, Sasko, Spekko and White Star brands) and beverages (7UP, Aquafina, Mirinda, Mountain Dew and Pepsi); – Asia/Pacific/Australia/New Zealand (5.3%): sale of snacks (BaiCaoWei, Cheetos, Doritos, Lay’s and Smith’s brands), beverages and syrups (7UP, Aquafina, Mirinda, Mountain Dew, Pepsi and Sting). Net sales are distributed geographically as follows: the United States (56.3%), Mexico (7.8%), Russia (4.2%), Canada (4.1%), China (3%), the United Kingdom (2.2%), South Africa (2%), Brazil (1.9%) and other (18.5%).

Trader
Trader
This super rating is the result of a weighted average of the rankings based on the following ratings: Valuation (Composite), EPS Revisions (4 months), and Visibility (Composite). We recommend that you carefully review the associated descriptions.
Investor
Investor
This super composite rating is the result of a weighted average of the rankings based on the following ratings: Fundamentals (Composite), Valuation (Composite), EPS Revisions (1 year), and Visibility (Composite). We recommend that you carefully review the associated descriptions.
Global
Global
This composite rating is the result of an average of the rankings based on the following ratings: Fundamentals (Composite), Valuation (Composite), Financial Estimates Revisions (Composite), Consensus (Composite) and Visibility (Composite). The company must be covered by at least 4 of these 5 ratings for the calculation to be carried out. We recommend that you carefully review the associated descriptions.
Quality
Quality
This composite rating is the result of an average of rankings based on the following ratings: Returns (Composite), Profitability (Composite) and Quality of Financial Reporting (Composite), and Financial Health (Composite). The company must be covered by at least 2 of these 3 ratings for the calculation to be performed. We recommend that you carefully read the associated descriptions.
ESG MSCI
ESG MSCI
The MSCI ESG score assesses a company’s environmental, social, and governance practices relative to its industry peers. Companies are rated from CCC (laggard) to AAA (leader). This rating helps investors incorporate sustainability risks and opportunities into their investment decisions.

Sell

Buy
Last Close Price
128.34USD
Average target price
146.05USD
Spread / Average Target
+13.80%

Select your edition
All financial news and data tailored to specific country editions