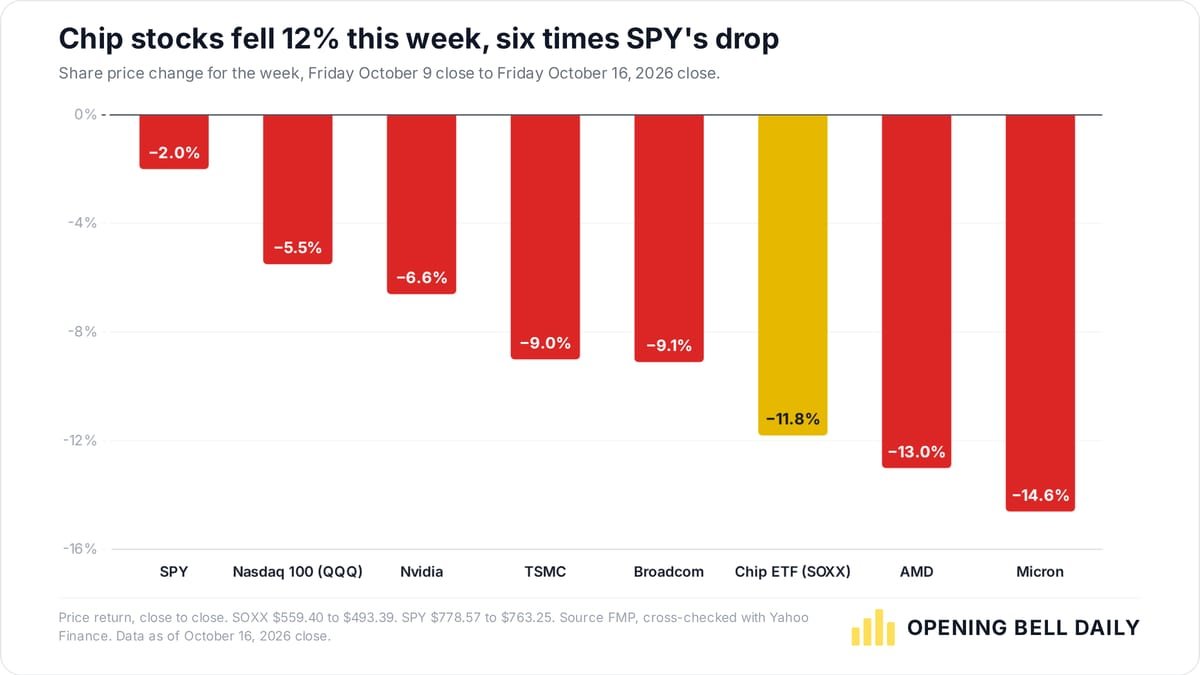
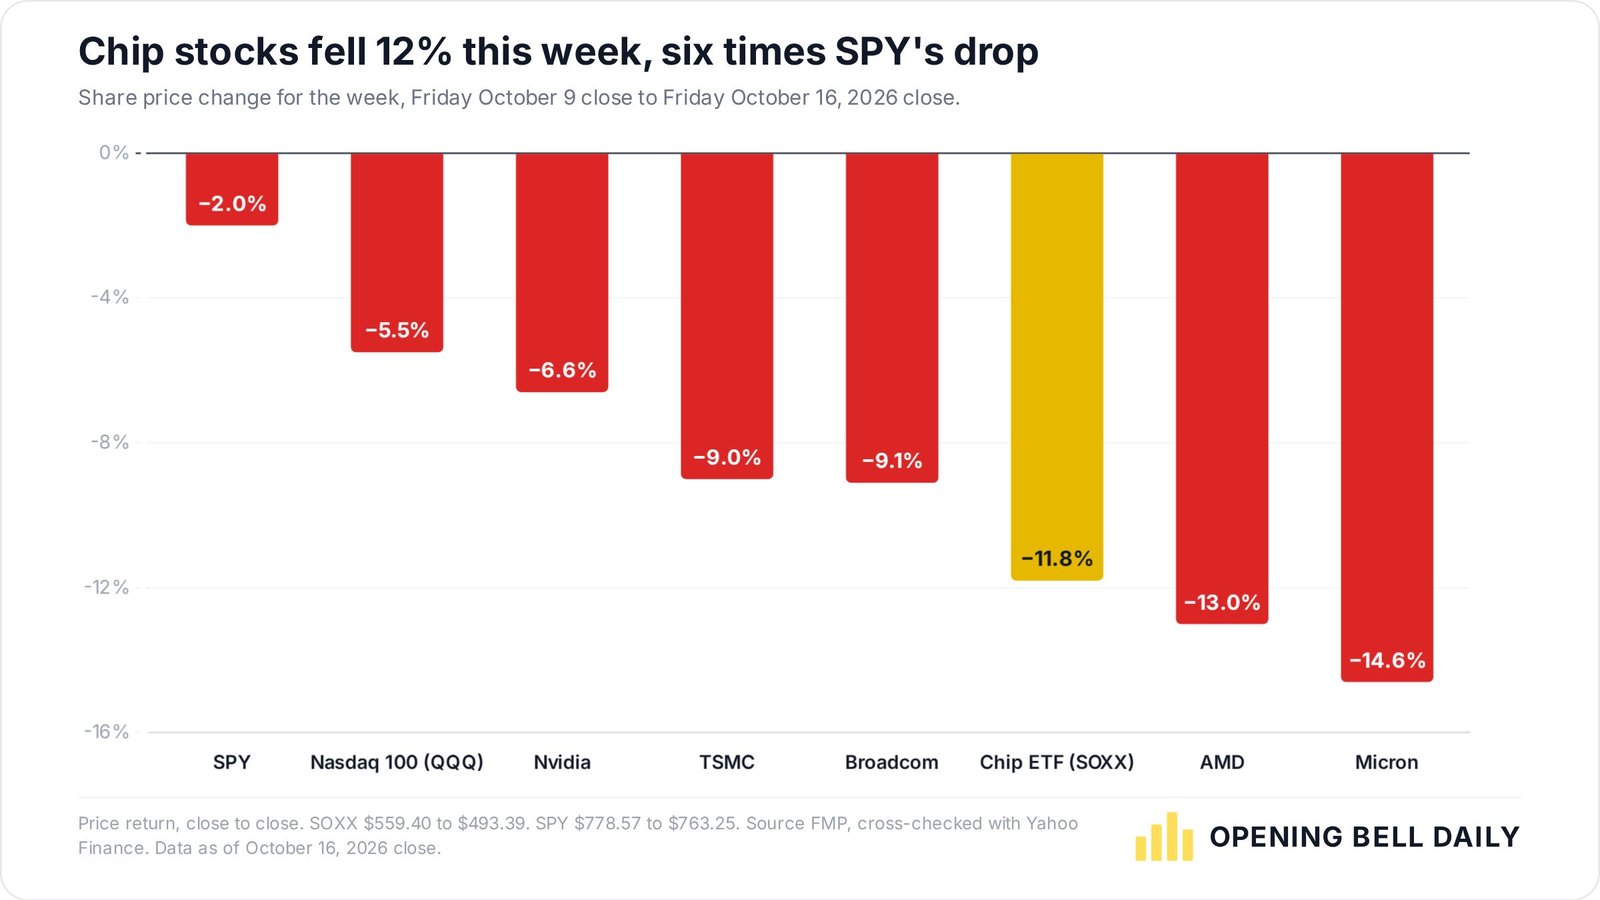
The iShares Semiconductor ETF (SOXX) fell 11.8% this week, six times the 2.0% drop in the S&P 500.
SOXX closed Friday, October 16, at $493.39, down from $559.40 on October 9.
The benchmark index slipped from $778.57 to $763.25 over the same stretch.
-
Micron -14.6%
-
AMD -13%
-
Broadcom -9.1%
-
TSMC -9.0%
-
Nvidia -6.6%
The Nasdaq 100 ETF (QQQ) lost 5.5%. Every chipmaker on the chart fell further than that.
Chipmakers have done much of the market’s heavy lifting in 2026. Nvidia, Micron, AMD and Intel added about $2.35 trillion in market value through October 15, 28% of the combined gain in S&P 500 stocks. A six-to-one gap in a single week shows how fast that trade can turn.