The stock market is entering the fifth year of the current bull market, which started in October 2022. During these past four years, the S&P 500 has surged nearly 120%, fueled by the artificial intelligence (AI) boom.
However, the question on many investors’ minds is how much longer the good times can last. There are certainly signs the bull market could be losing steam. The breadth of market winners is actually quite narrow, with only a handful of stocks helping power the index. In fact, over a quarter of stocks in the S&P 500 (^GSPC -1.15%) are actually down 40% or more from their all-time highs, while nearly 60% of S&P 500 stocks are below their 200-day moving average.
Meanwhile, renowned investors like Michael Burry, who correctly called the housing bubble, and billionaire hedge fund manager Ray Dalio have been predicting that the AI bubble will burst. Burry has been very vocal, shorting several popular AI stocks, including Nvidia, Micron Technology, and Palantir Technologies, while comparing the current market to before the 2000 dot-com bubble. Dalio, meanwhile, has said the AI boom shows classic signs of a bubble ready to burst.

Image source: Getty Images.
One of the strongest indicators that the current bull market could be coming to an end is the cyclically adjusted price-to-earnings (CAPE) ratio. Created by Yale economist Robert Shiller in 1988, it measures the value of the S&P index relative to its 10-year average inflation-adjusted earnings. The purpose of this is to smooth out periods of earnings boom and bust cycles.
The valuation metric currently sits above 40, which is its second-highest level ever. The only two other times the CAPE ratio has moved above 32 were right before the Great Depression in 1929, when it reached 32.6, and during the dot-com bubble, when it peaked at 44.2. Both times the CAPE hit these levels, huge market corrections followed.
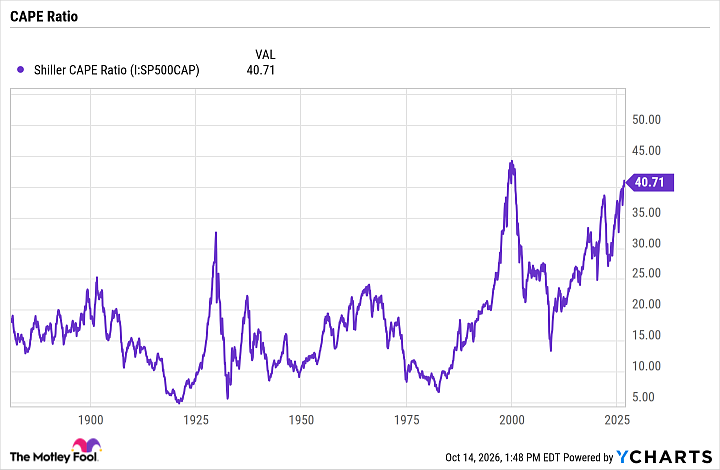
Shiller CAPE Ratio data by YCharts
How investors should prepare for a potential market correction
Given the current warning signs in the market, it may seem like the common-sense thing to do would be to sell stocks and step to the sidelines. However, this would likely be a bad decision, as trying to time the stock market rarely works, and even if it does, then you’d have to correctly time getting back in as well. Miss out on some of the largest days in the stock market, and your investment returns could suffer significantly.
For example, Hartford Funds found that 76% of the market’s best days have happened during a bear market or the first two months of a bull market, and if you missed the 10 best days in the market over the past 30 years, your return would be cut in half.
Instead, I prefer to follow the advice of legendary investor Peter Lynch, who generated an astonishing 29.2% average annual return while running Fidelity’s flagship Magellan Fund. In a 1995 interview with Worth magazine, he said:
Far more money has been lost by investors preparing for corrections or trying to anticipate corrections than has been lost in corrections themselves. … [i]n the long run it doesn’t matter much whether your timing is good or bad. What matters is that you stay invested in stocks.
In the same article, Lynch used the example that if you had invested $2,000 in the S&P 500 every year on Jan. 1 from 1965 until the time the article was written in 1995, you’d have an 11% yearly return. However, if you were unlucky enough to invest at the market peak each year, your return would only drop to 10.6%.
VOO Vanguard S&P 500 ETF
$700.86-$8.58 (-1.21%)
NYSEMKT · As of 2:04 PM ET 10/16/26
The lesson is ultimately that the best way to prepare for a potential market crash is to not prepare at all. You’ll be far better off in the long term consistently dollar-cost averaging into an index exchange-traded fund (ETF) like the Vanguard S&P 500 ETF (VOO -1.21%) than trying to time a potential market crash.